My research concerns many different aspects of Information Visualisation and Visual Analytics. In other words, I am interested in visual interfaces for the exploration and communication of data. An area of key interest for me is network visualization, which I believe has a critical role to play in helping people to understand complex, interlinked data.
Network visualisation is already widely used in disciplines like
software engineering, biology and social network analysis; however, I
believe it can play a greater role in many other areas of our lives
if we can present complex information to people in an understandable and
engaging way.
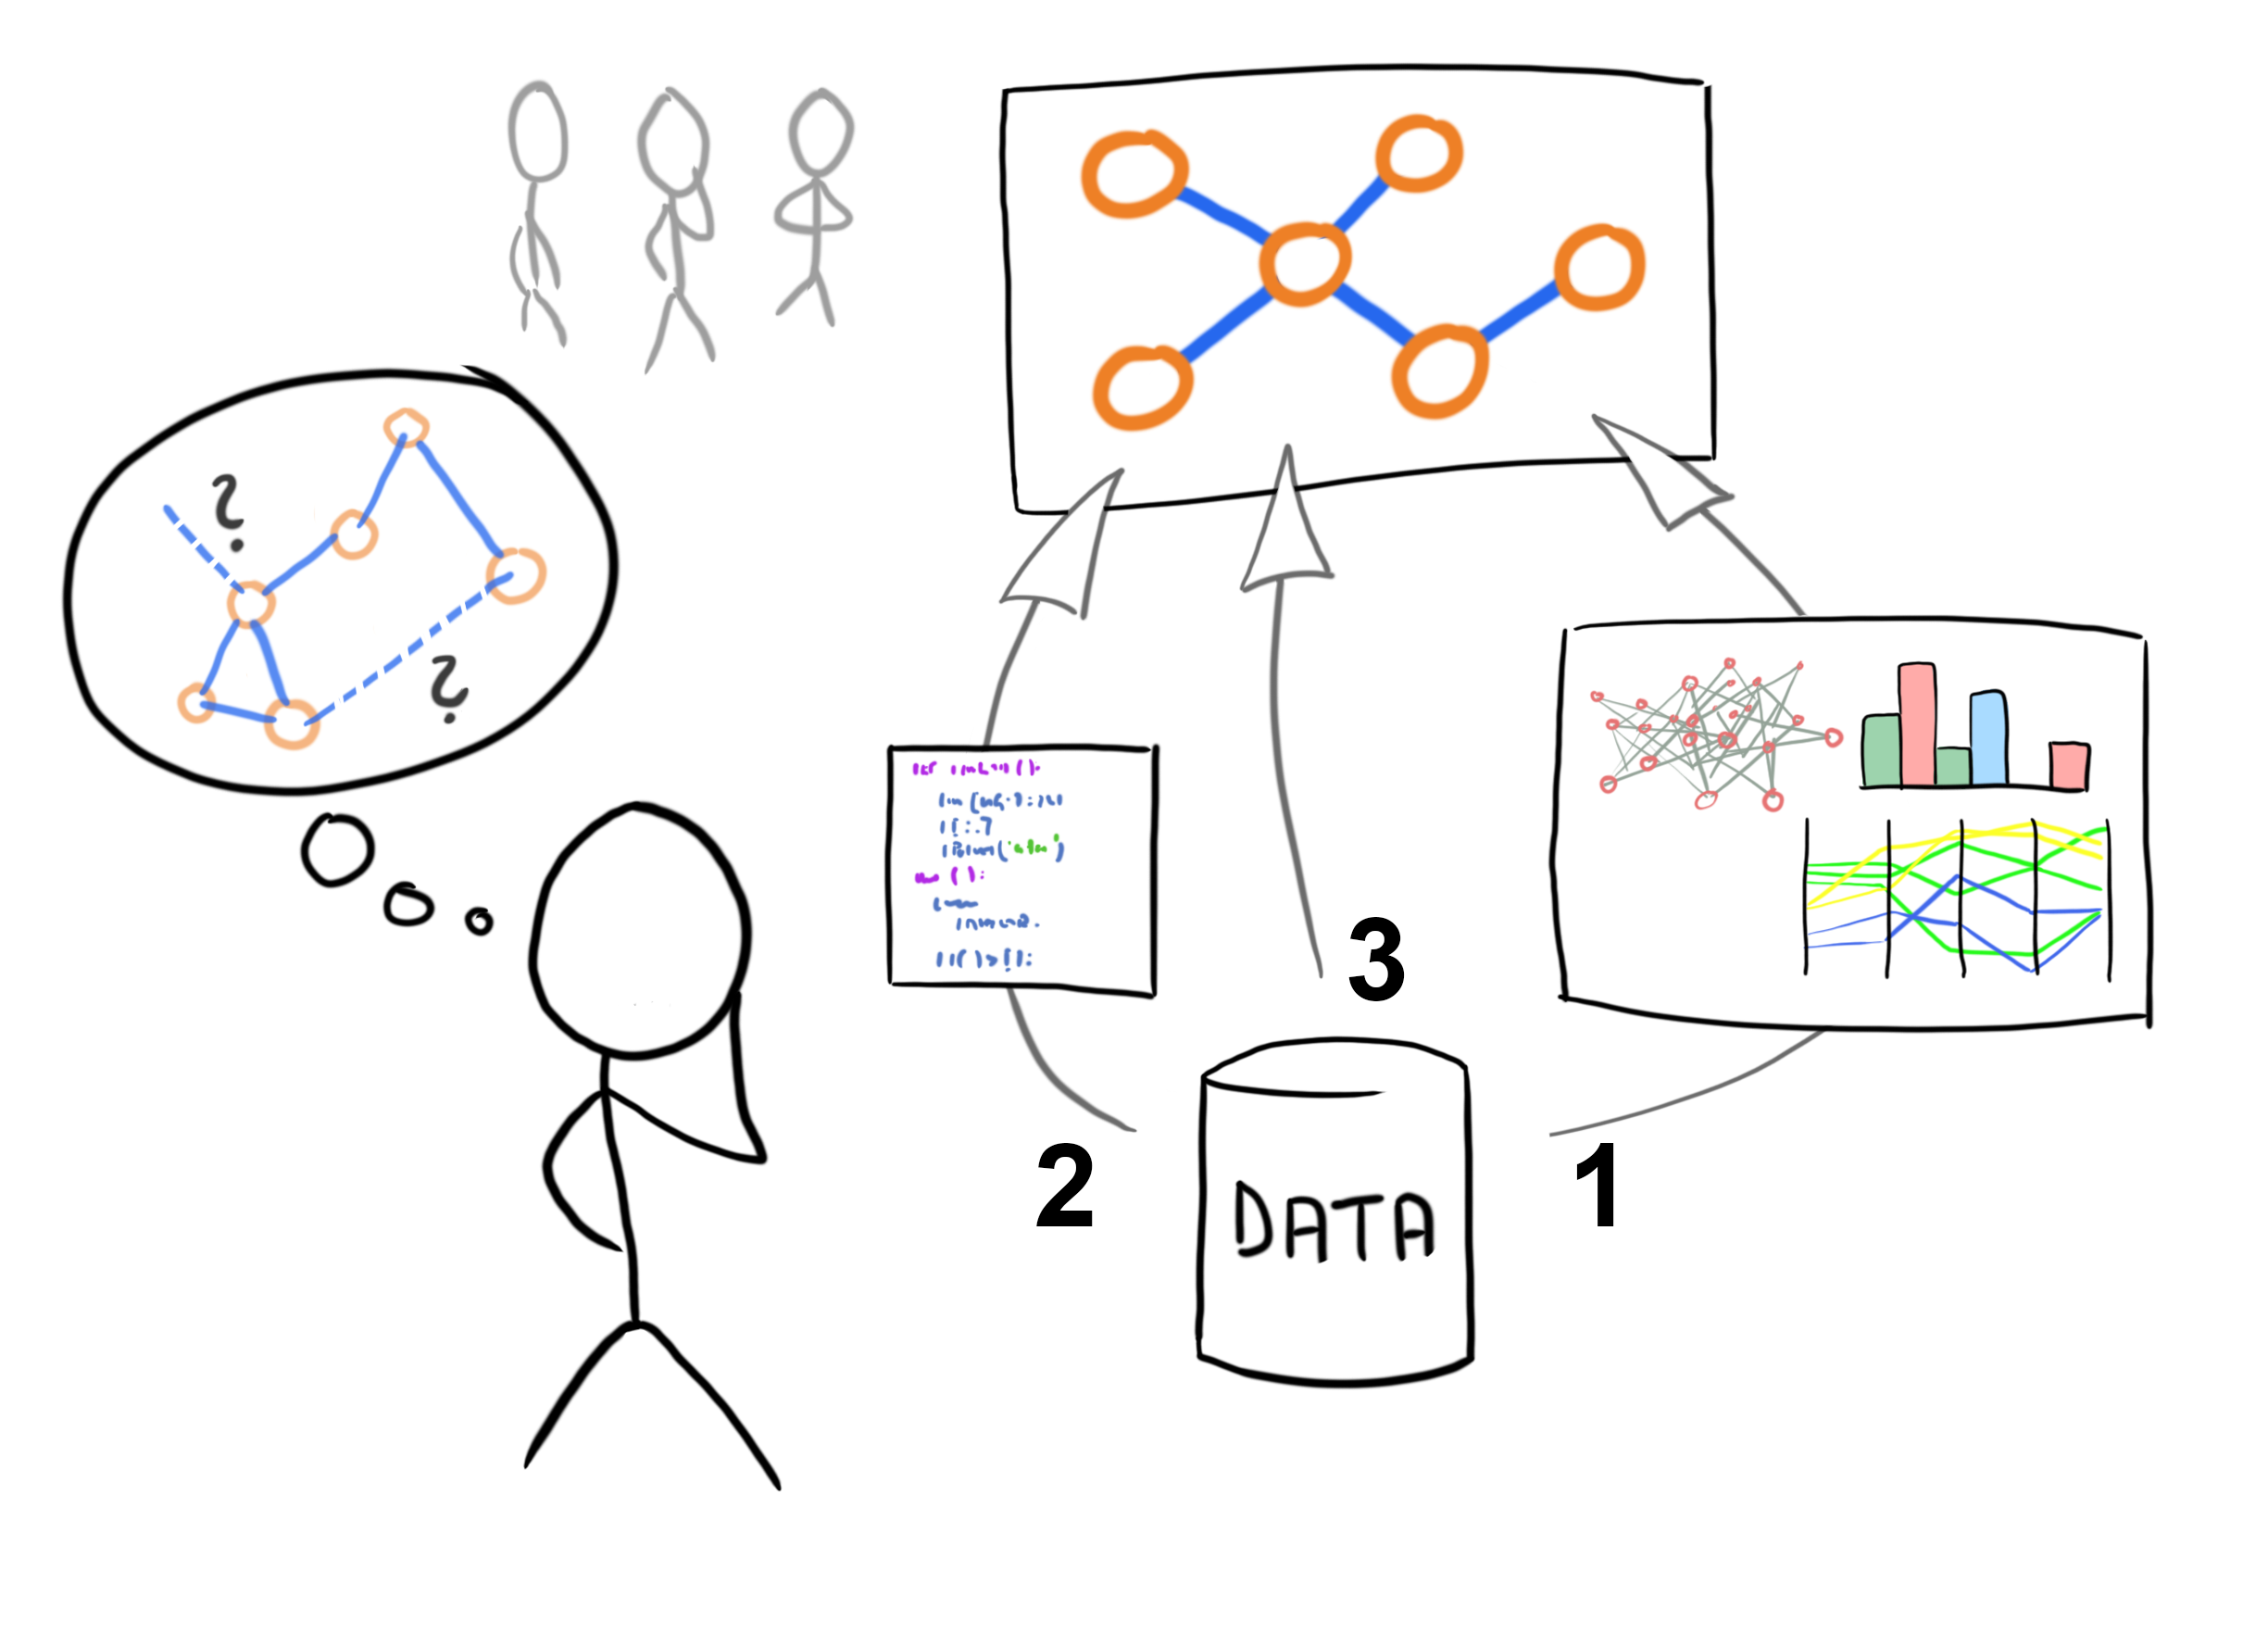
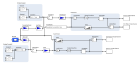
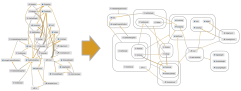
Much of my work has focused on the problem of finding high-quality
layout for network diagrams. To create such diagrams automatically, we must
compute positions for nodes and paths for links that are both
readable and aesthetically pleasing. This computation is a significant optimisation
challenge that tests the limits of current technologies.
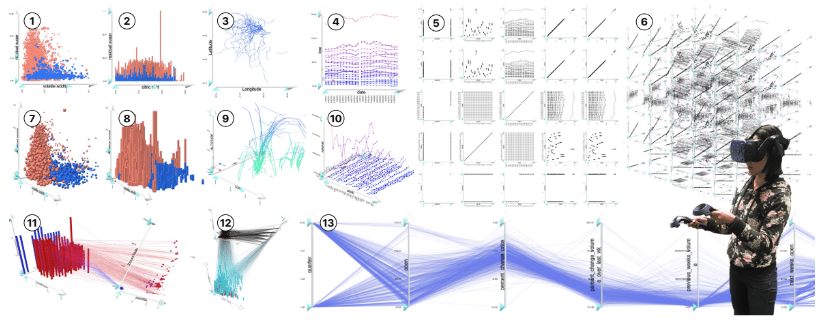
I am also interested in the development of novel representations of
data and all aspects of interaction design for data exploration.
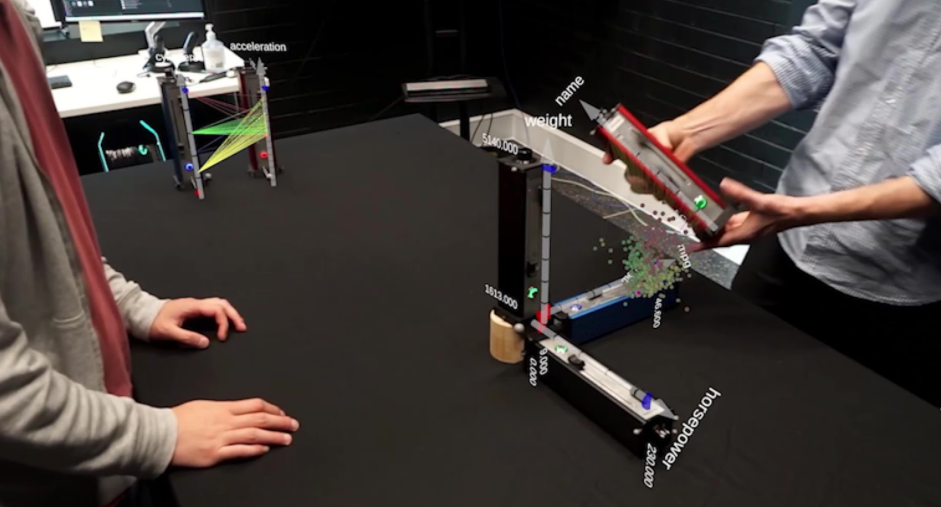
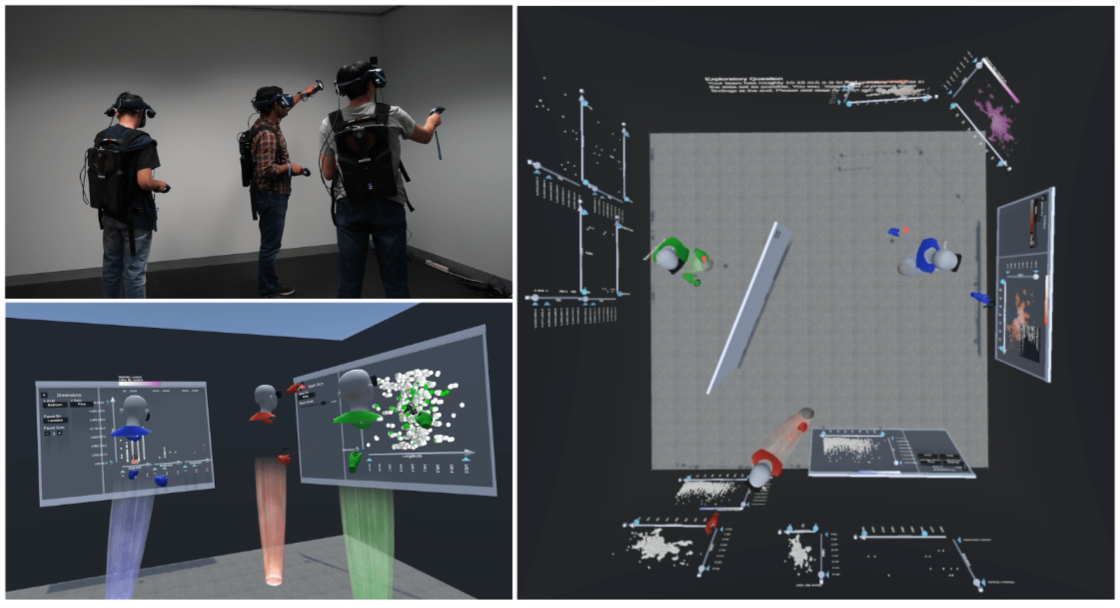
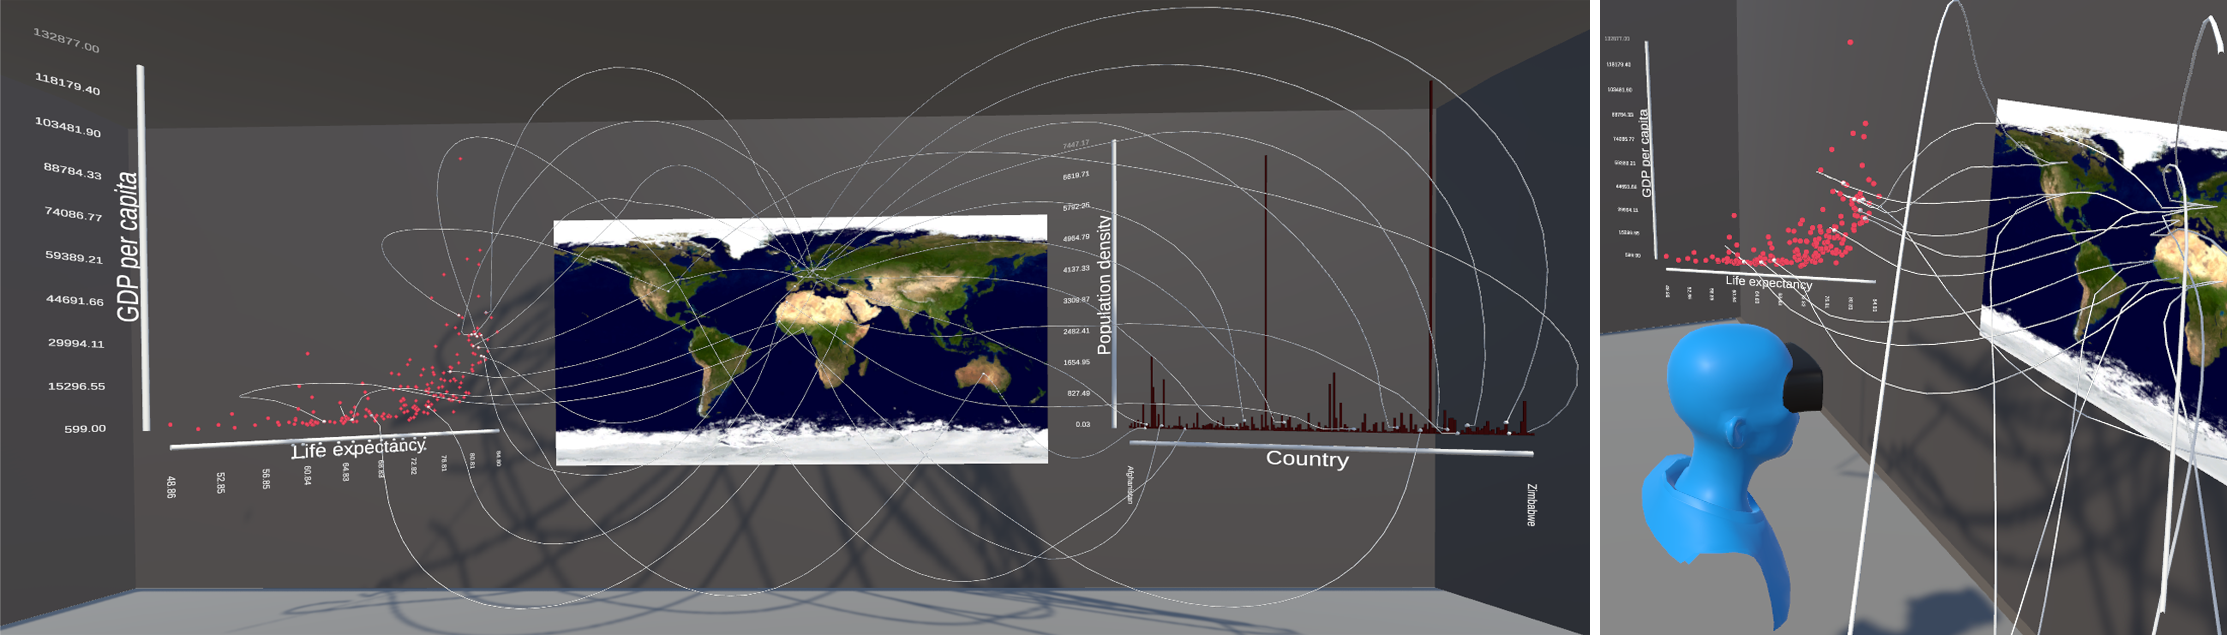
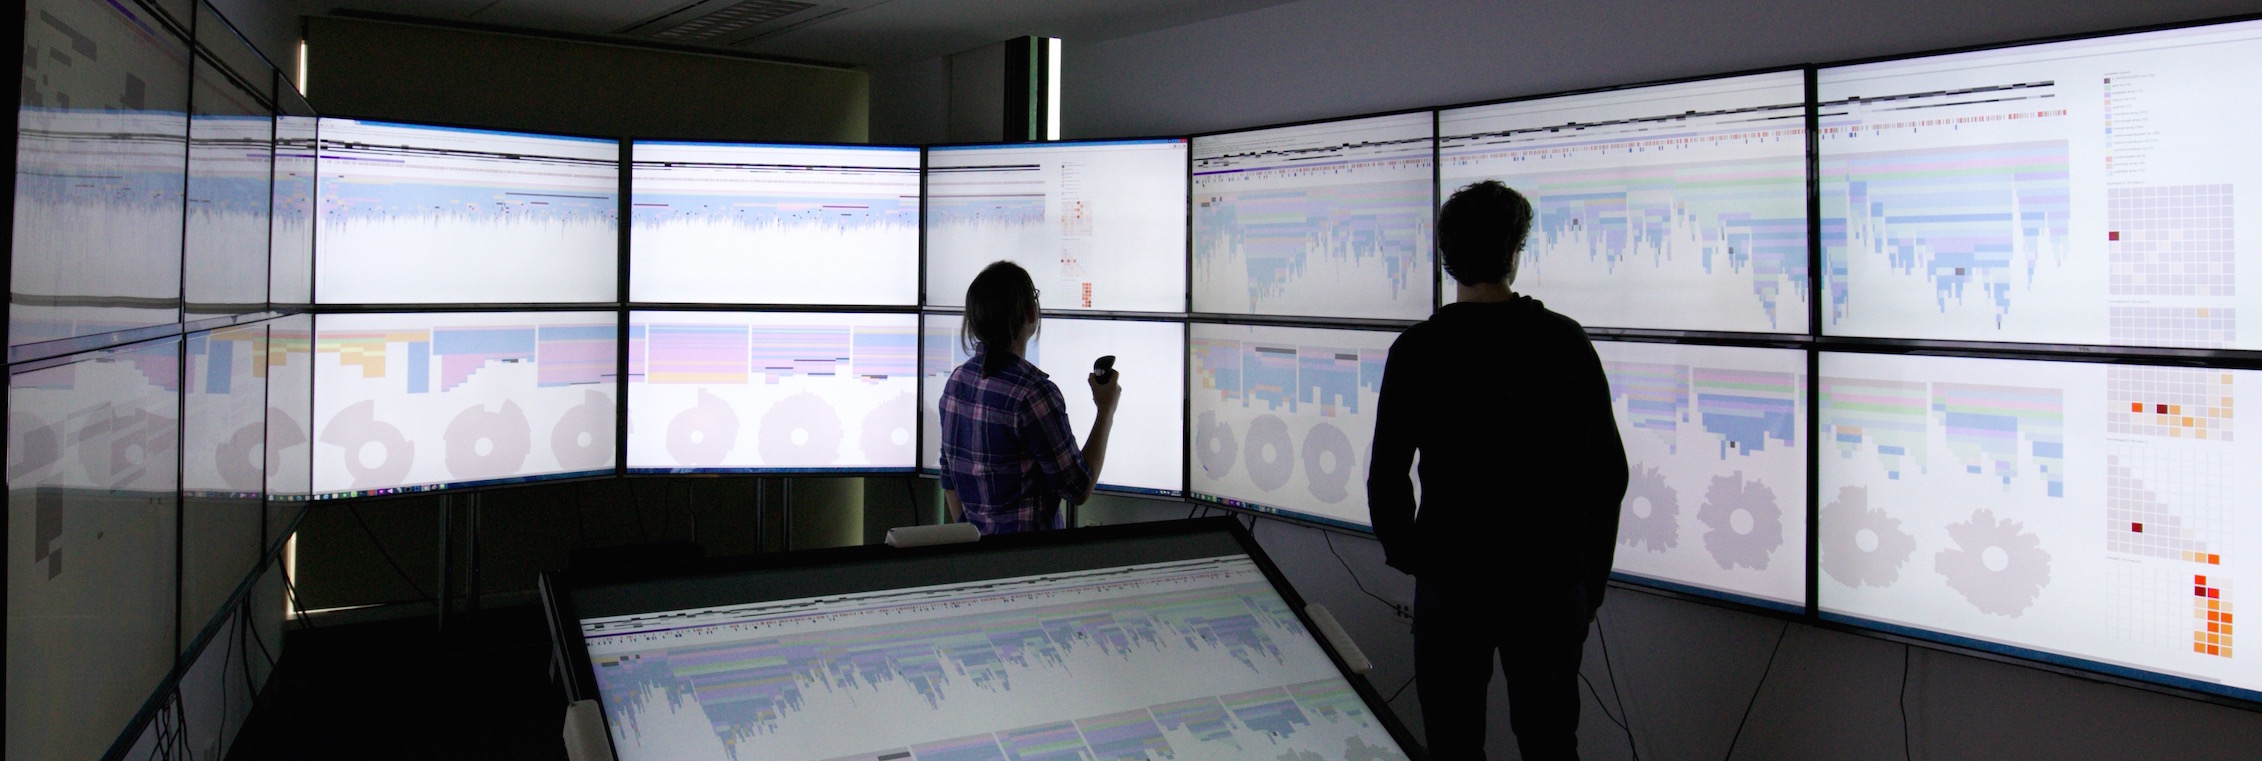
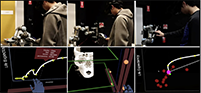
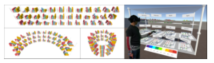
Another aspect of my research is the exploration of how we can effectively use emerging display technologies—such as large interactive surfaces and augmented and virtual reality—to help people
perform data analysis. We are bringing data "out of computers and into the world around us". We call this research initiative Immersive Analytics (interview,book).
from the University of
Sydney in 2005. I was a post-doctoral Research Fellow at Monash University
from 2005 to 2008, then a Visiting Researcher at Microsoft Research, USA in
2008-2009. From 2009 to 2012 I worked as a Senior Software Development Engineer with
the Visual Studio product group at Microsoft, USA. A highlight of this period
was shipping the
software dependency visualisation tool with Visual Studio 2012. In late 2012 I
returned to Monash University as a Larkins Fellow where I now direct the
.

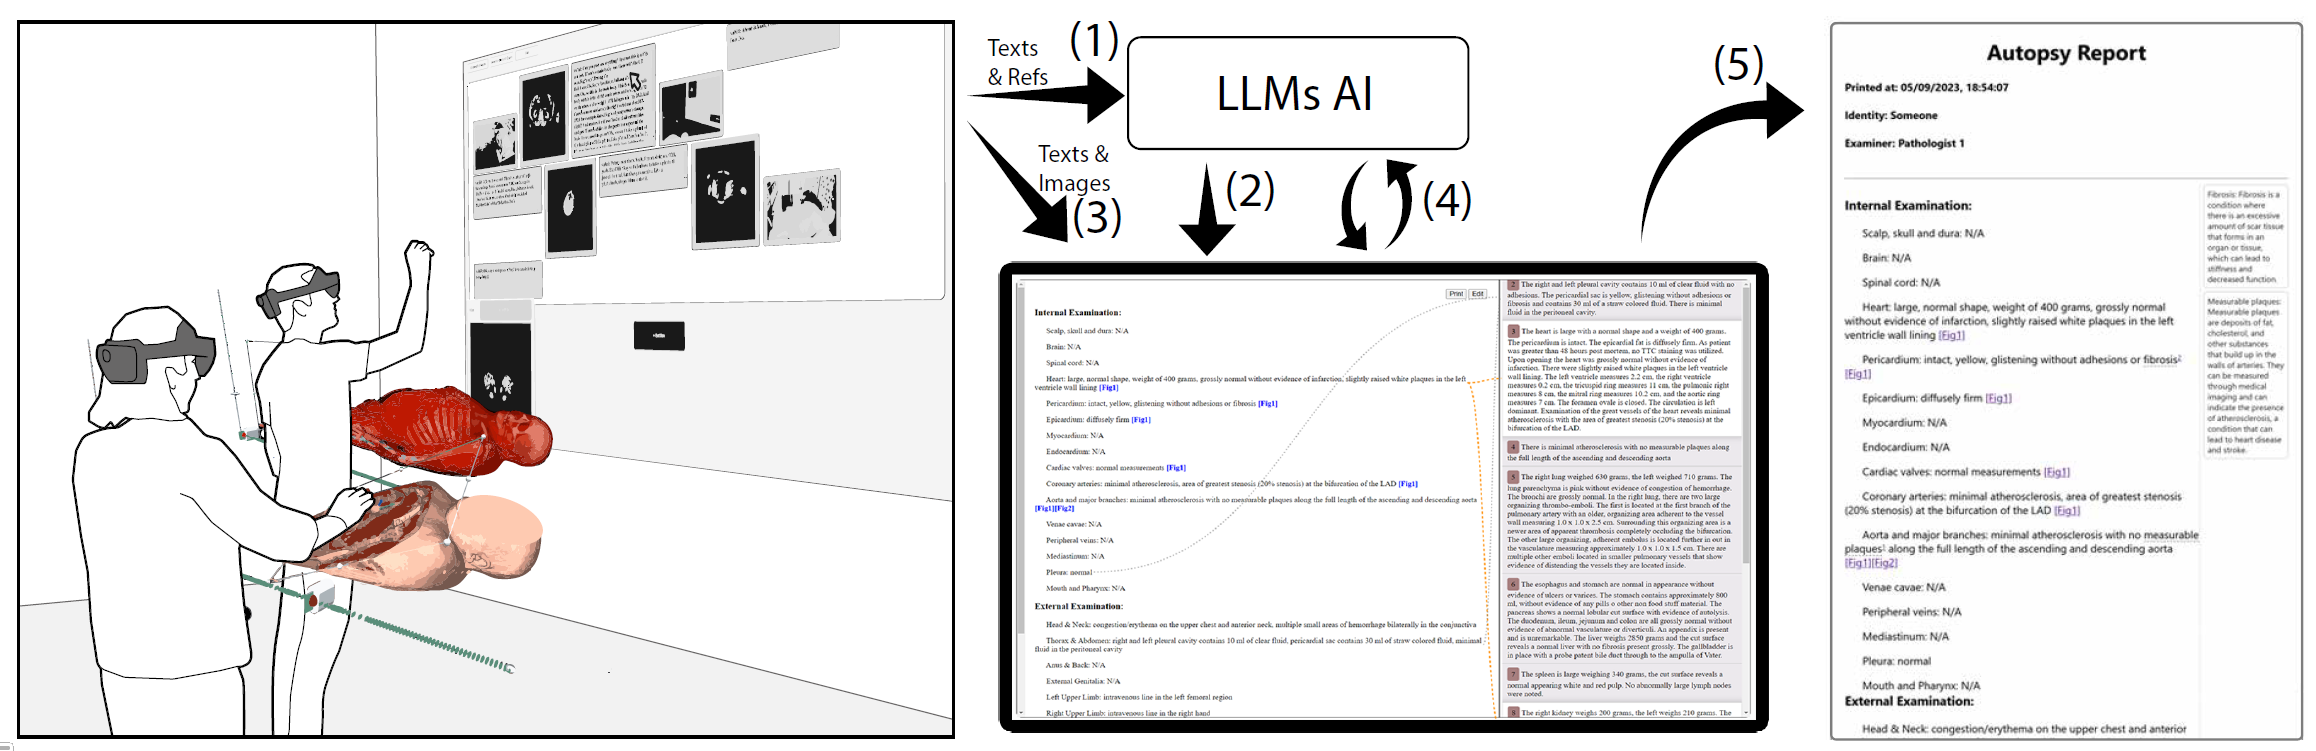
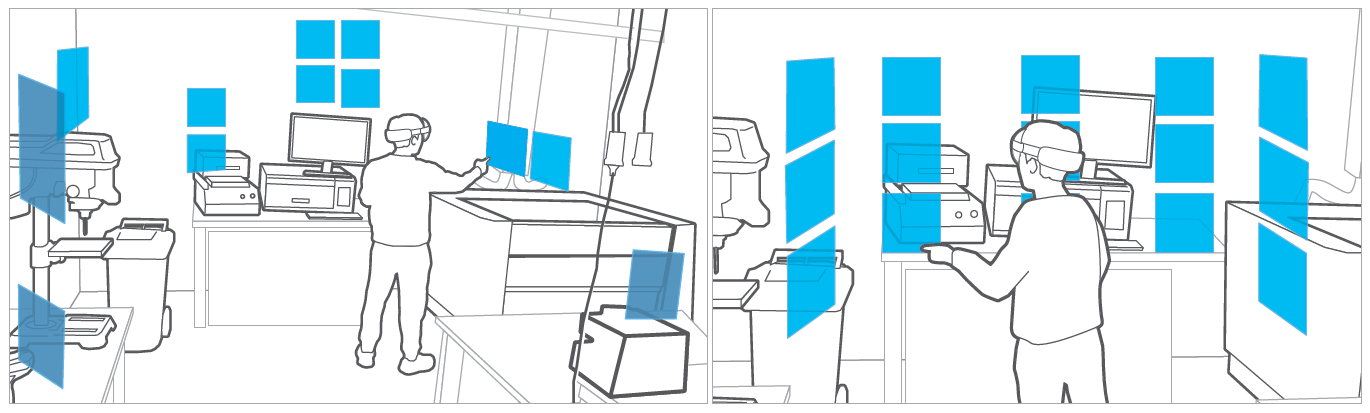
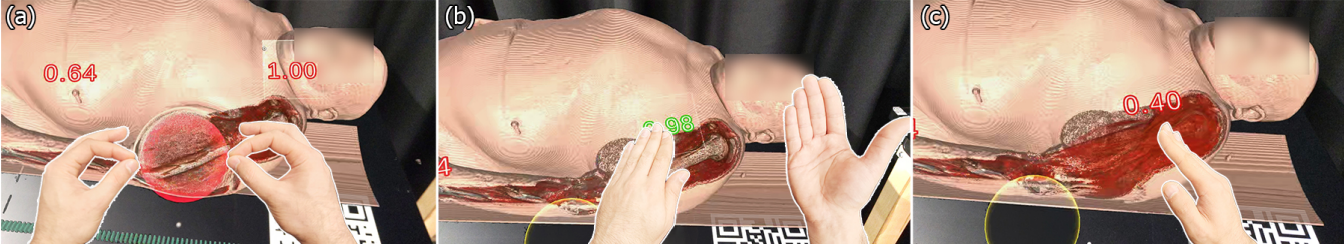
Collaborative Forensic Autopsy Documentation and Supervised Report Generation using a Hybrid Mixed-Reality Environment and Generative AI.
V. Pooryousef, M. Cordeil, L. Besançon, R. Bassed, T. Dwyer.
IEEE TVCG - Presented at ISMAR 2024
pre-print

Investigating the Effects of Physical Landmarks on Spatial Memory for Information Visualisation in Augmented Reality.
J. Liu, K. Ananta Satriadi, B. Ens, T. Dwyer.
ISMAR 2024
pre-print

Working with Forensic Practitioners to Understand the Opportunities and Challenges for Mixed-Reality Digital Autopsy.
V. Pooryousef, M. Cordeil, L. Besançon, C. Hurter, T. Dwyer, R. Bassed.
ACM CHI 2023
pre-print
Increasing User Trust in Optimisation through Feedback and
Interaction
Jie Liu, Kim Marriott, Tim Dwyer, Guido Tack
Transactions on Computer Human Interaction
pre-print
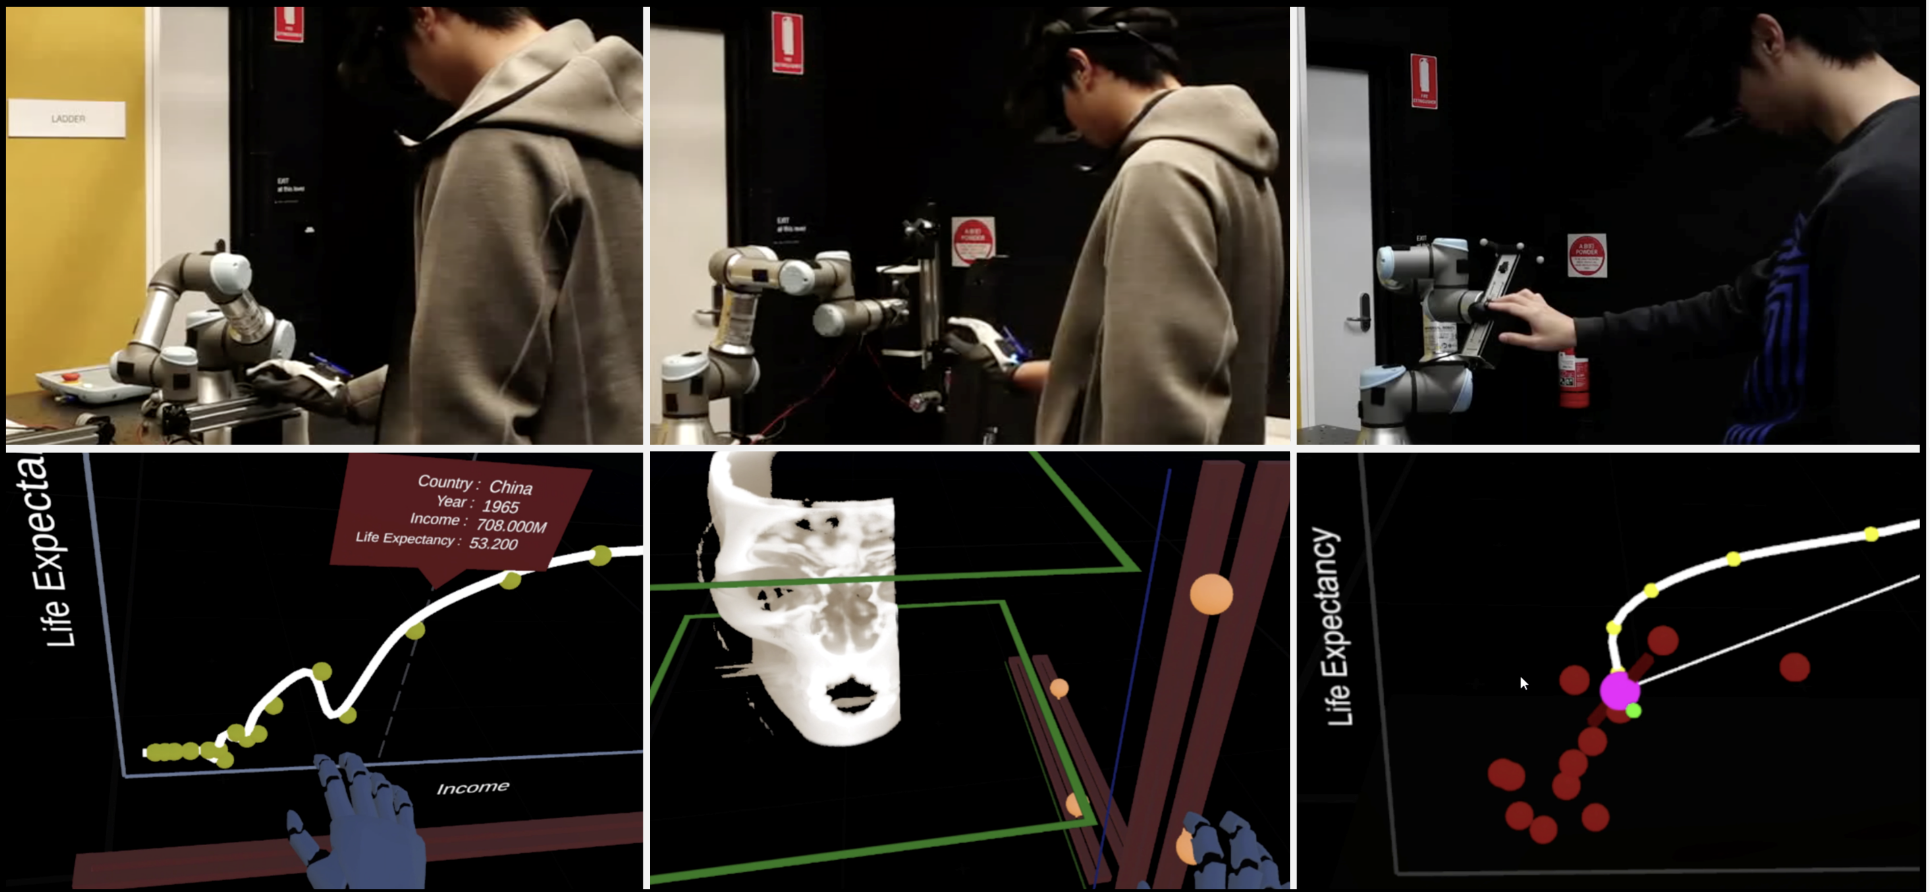
RoboHapalytics: A Robot Assisted
Haptic Controller for Immersive Analytics
Shaozhang Dai, Jim Smiley, Tim Dwyer, Barrett Ens, and Lonni Besancon
IEEE VIS 2022
pre-print

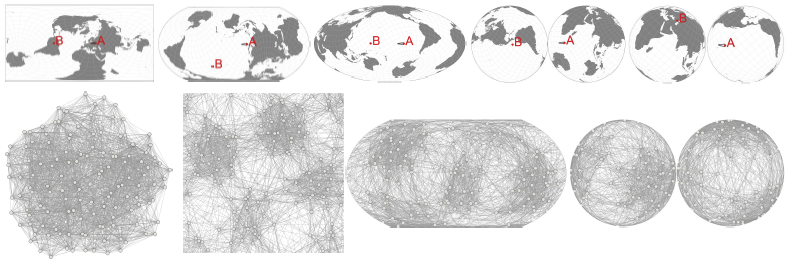
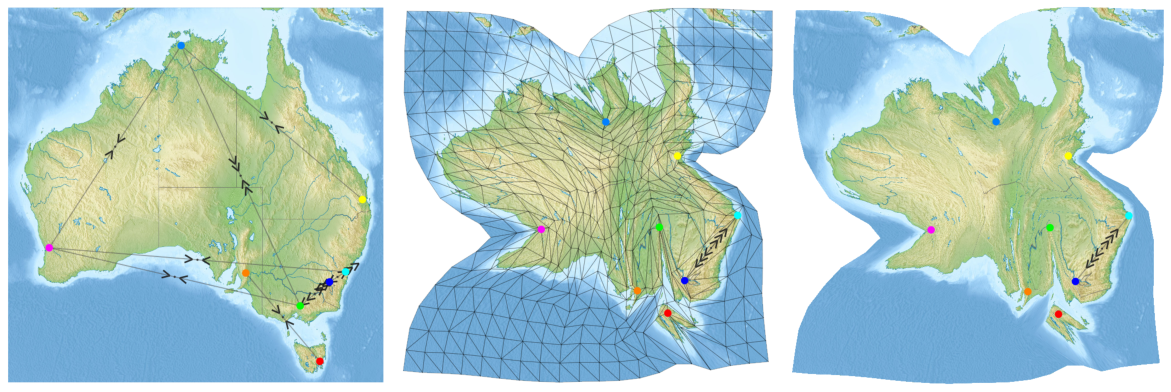
GAN'SDA Wrap: Geographic And Network Structured DAta on surfaces that Wrap around
Kun-Ting Chen, Tim Dwyer, Yalong Yang, Benjamin Bach, Benjamin Bach, Kim Marriott
ACM CHI, 2022.
pre-print
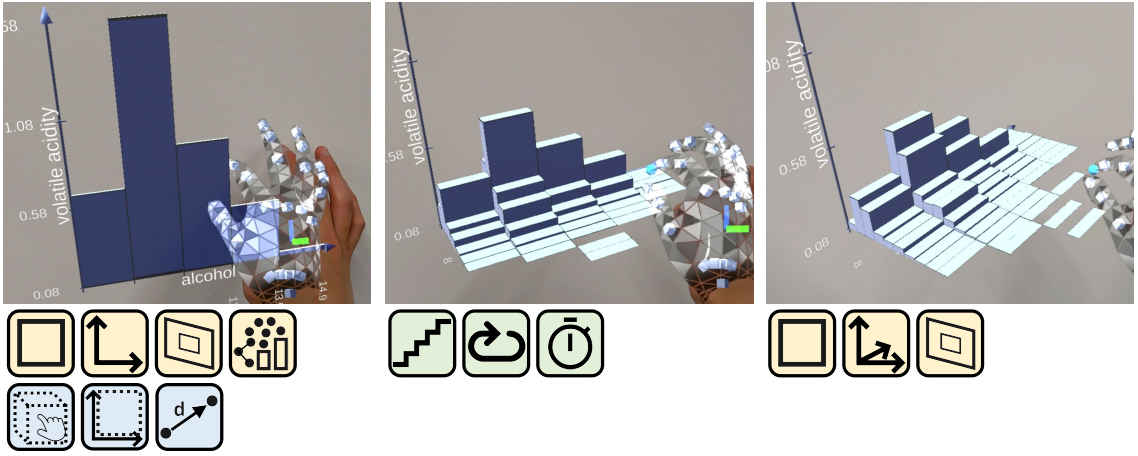
Design Space For Data Visualisation Transformations Between
2D And 3D In Mixed-Reality Environments
Benjamin Lee, Maxime Cordeil, Arnaud Prouzeau, Bernhard Jenny, Tim Dwyer
ACM CHI, 2022.
pre-print
video

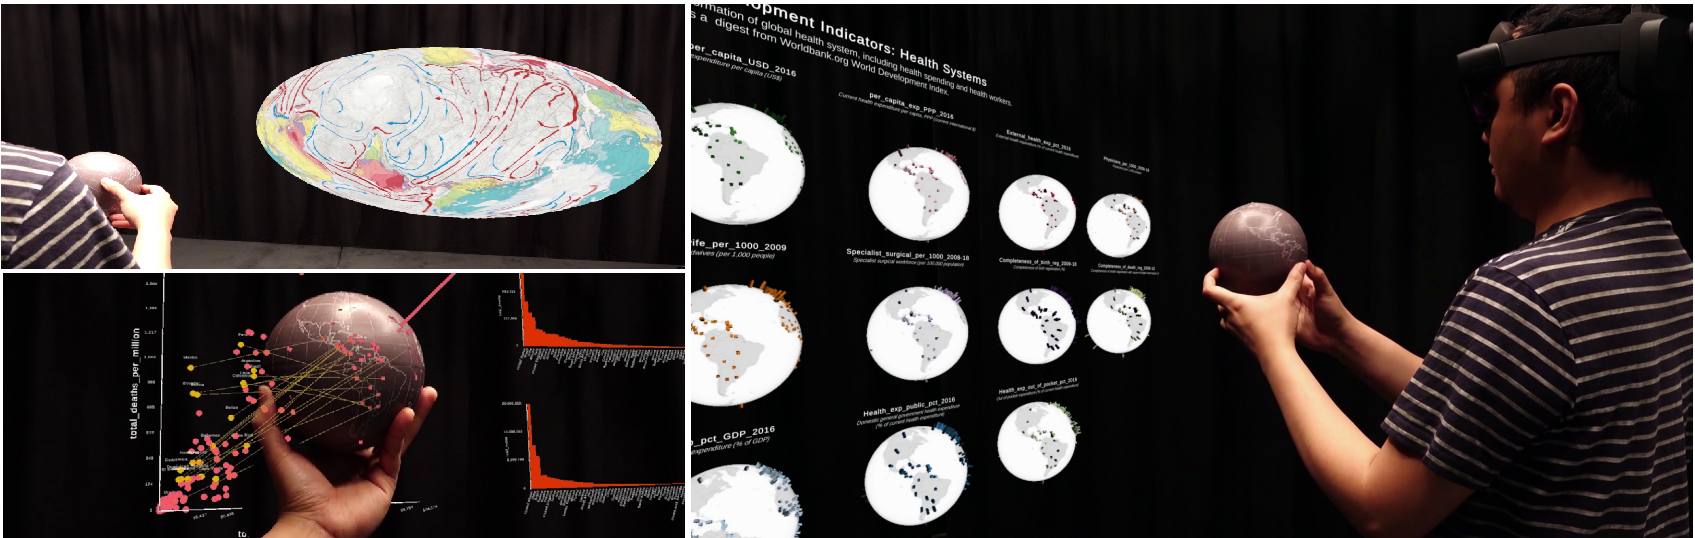
Tangible Globes for Data Visualisation in Augmented Reality
Kadek Ananta Satriadi, Jim Smiley, Barrett Ens, Maxime Cordeil, Tobias Czauderna, Benjamin Lee, Ying Yang, Tim Dwyer, Bernhard Jenny
ACM CHI, 2022.
pre-print

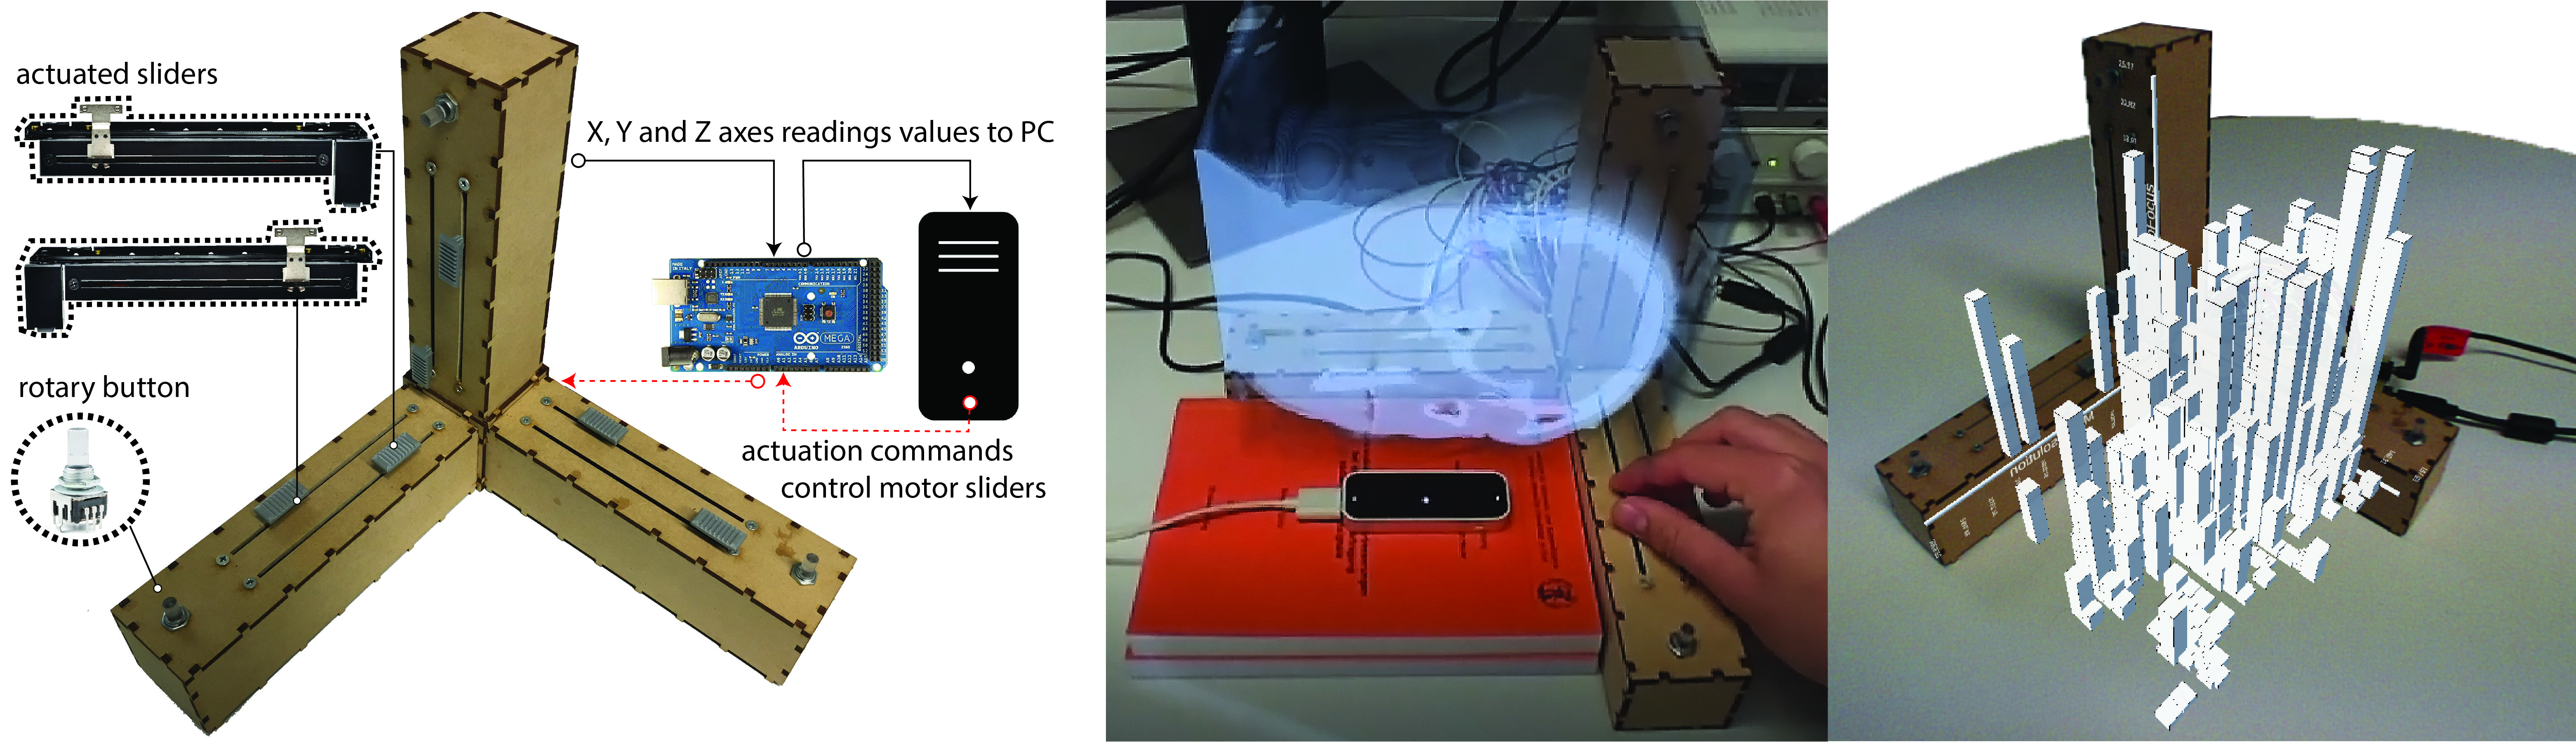
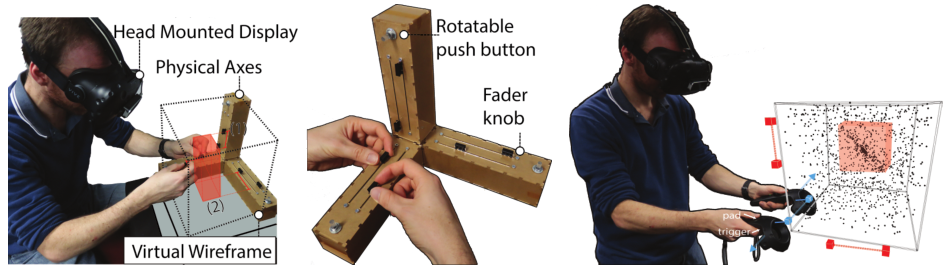
The MADE-Axis: A Modular Actuated Device to Embody the Axis of a Data Dimension
Jim Smiley, Benjamin Lee, Siddhant Tandon, Maxime Cordeil, Lonni Besançon, Jarrod Knibbe, Bernhard Jenny, Tim Dwyer
Proceedings of the ACM on Human-Computer Interaction 5, ISS, pp. 1-23, ACM, 2021.
pre-print

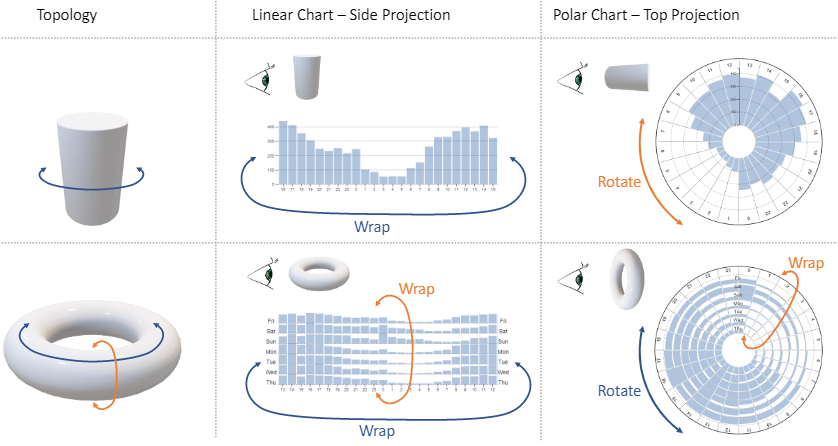
Rotate or Wrap? Interactive Visualisations of Cyclical Data on Cylindrical or Toroidal Topologies
Kun-Ting Chen, Tim Dwyer, Benjamin Bach, Kim Marriott
IEEE Transactions on Visualization and Computer Graphics, 2021
pre-print

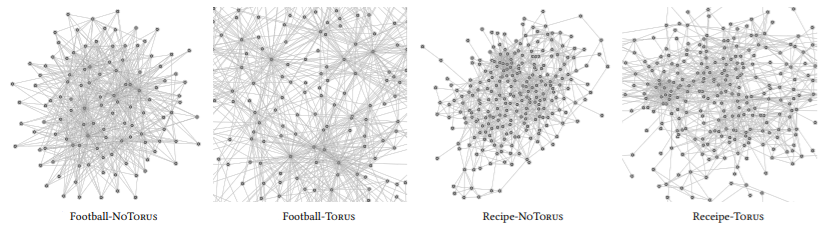
It’s a Wrap: Toroidal Wrapping of Network Visualisations Supports Cluster Understanding Tasks
Kun-Ting Chen, Tim Dwyer, Benjamin Bach, Kim Marriott
Proceedings of the 2021 CHI Conference on Human Factors in Computing Systems
pre-print

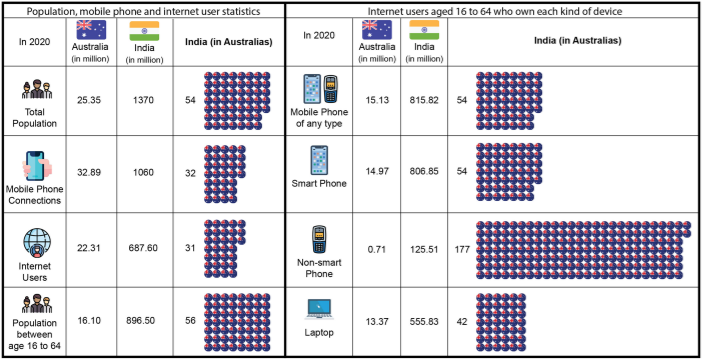
The Next Billion Users of Visualization
Amit Jena, Matthew Butler, Tim Dwyer, Kirsten Ellis, Ulrich Engelke, Reuben Kirkham, Kim Marriott, Cecile Paris, Venkatesh Rajamanickam
IEEE Computer Graphics and Applications, 41(2), 8-16, 2021.
pre-print

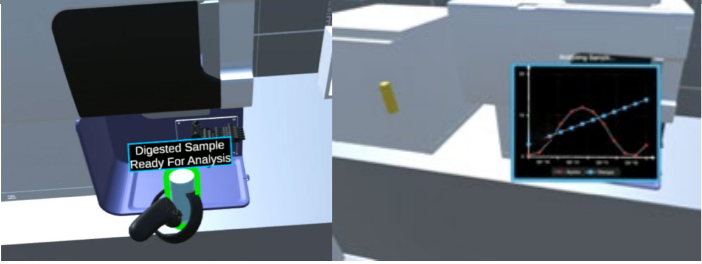
Where the data is: An exploratory study of mixed-reality in the wet lab domain
Peter Hoghton, Henry Linger, Maxime Cordeil, Tim Dwyer, Kim Marriott, Luke Visser
Twenty-Ninth European Conference on Information Systems (ECIS 2021)
pre-print

Scalability of Network Visualisation from a Cognitive Load Perspective
Vahan Yoghourdjian, Yalong Yang, Tim Dwyer, Lee Lawrence, Michael Wybrow, Kim Marriott
IEEE InfoVis Conference (IEEE VIS), to appear in IEEE TVCG, 2020.
pre-print
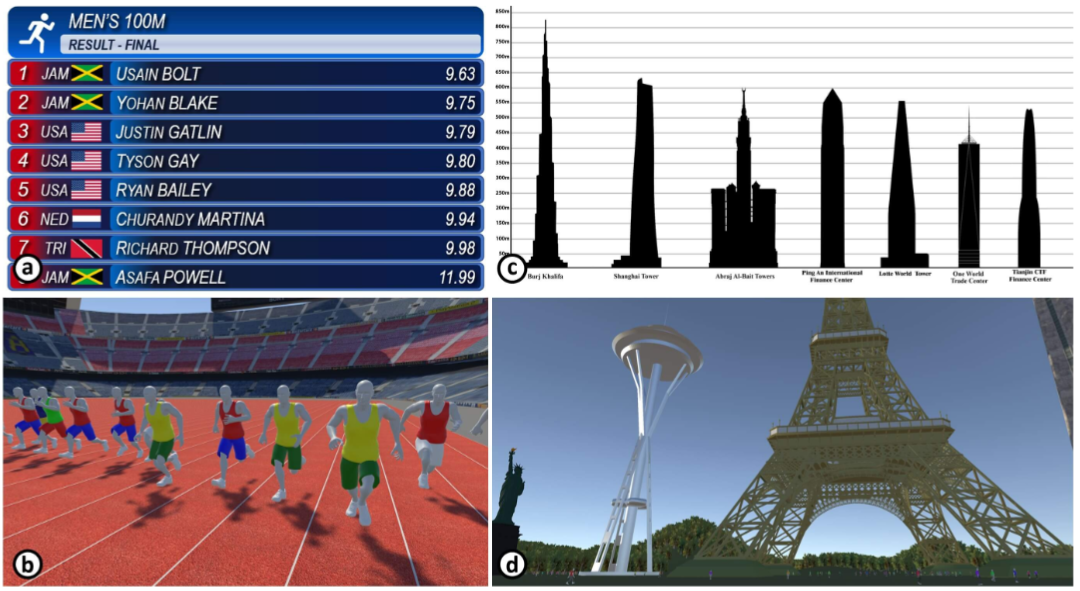
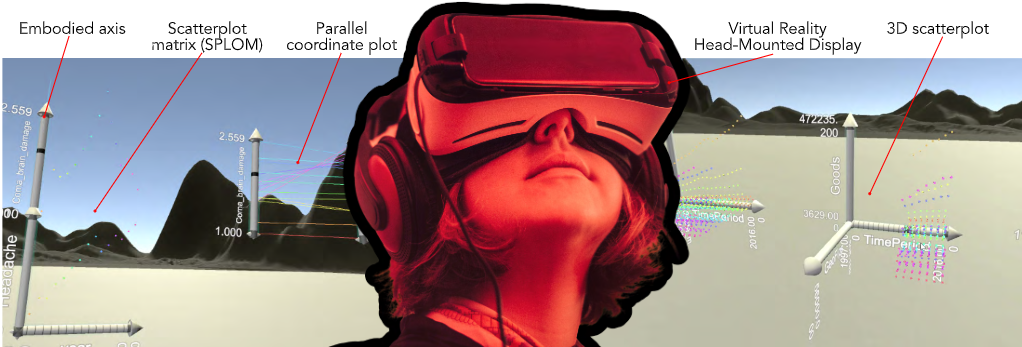
Data Visceralization: Enabling Deeper Understanding of Data Using Virtual Reality
Benjamin Lee, David Brown, Bongshin lee, Christophe Hurter, Steven Drucker, Tim Dwyer
IEEE InfoVis Conference (IEEE VIS), Honourable Mention for Best Paper, to appear in IEEE TVCG, 2020.
pre-print

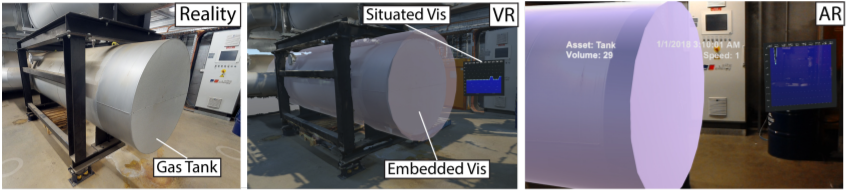
Corsican Twin: Authoring In Situ Augmented Reality Visualisations in Virtual Reality
A. Prouzeau, Y. Wang, B. Ens, W. Willett, T. Dwyer
AVI '20: International Conference on Advanced Visual Interfaces, ACM, 2020
pre-print
video
Shared Surfaces and Spaces: Collaborative Data Visualisation in a Co-located Immersive Environment
Benjamin Lee, Xiaoyun Hu, Maxime Cordeil, Arnaud Prouzeau, Bernhard Jenny, Tim Dwyer
IEEE InfoVis Conference (IEEE VIS), to appear in IEEE TVCG, 2020.
pre-print

Embodied Navigation in Immersive Abstract Data Visualization: Is Overview+Detail or Zooming Better for 3D Scatterplots?
Yalong Yang, Maxime Cordeil, Johanna Beyer, Tim Dwyer, Kim Marriott, Hanspeter Pfister
IEEE InfoVis Conference (IEEE VIS), to appear in IEEE TVCG, 2020.
pre-print
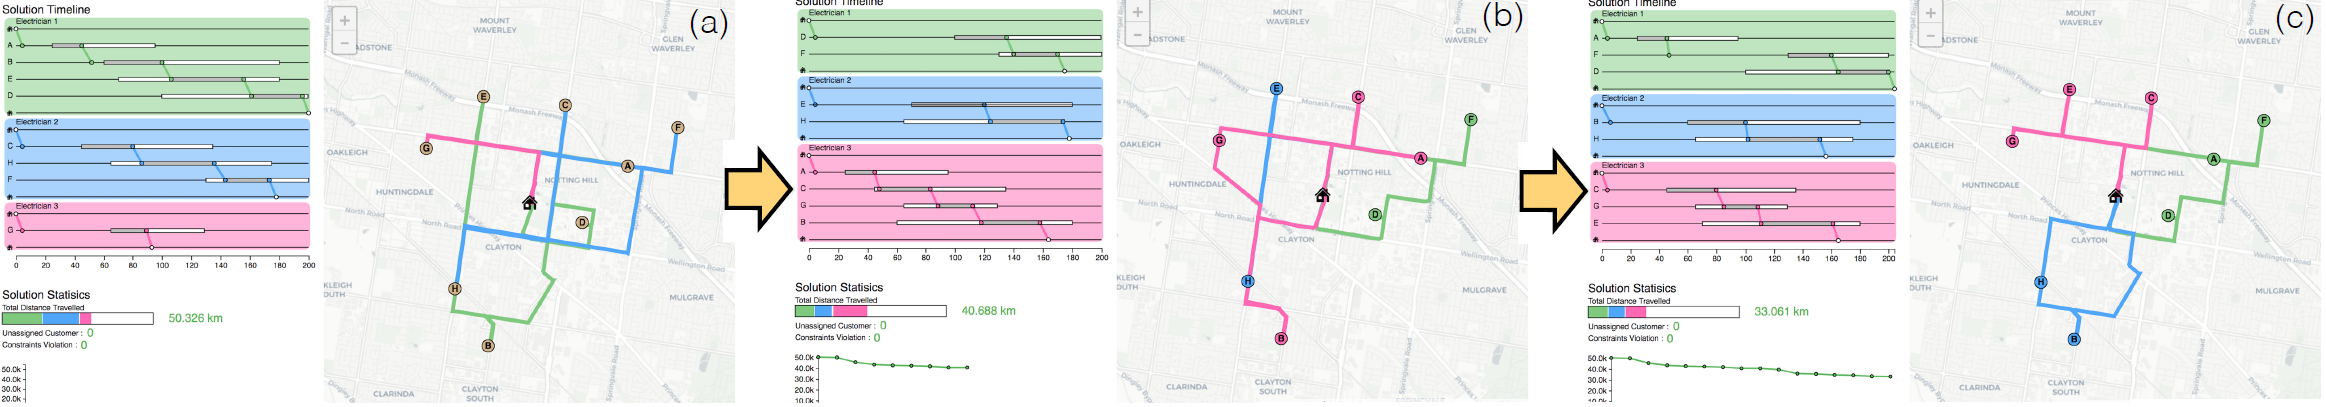
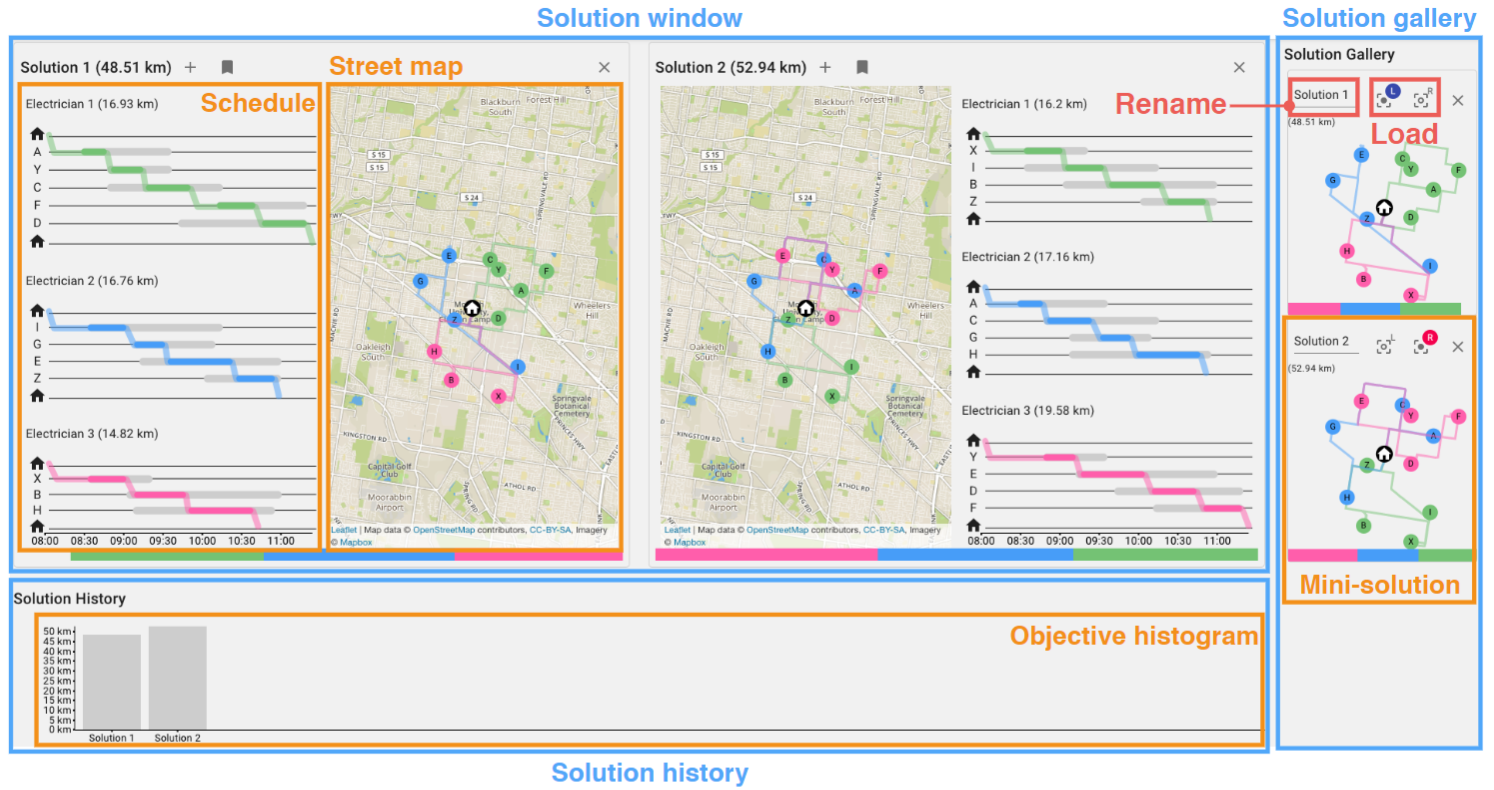
Supporting the Problem-Solving Loop: Designing Highly Interactive Optimisation Systems
Jie Liu, Tim Dwyer, Guido Tack, Samuel Gratzl, Kim Marriott
IEEE VAST Conference (IEEE VIS), to appear in IEEE TVCG, 2020.
pre-print

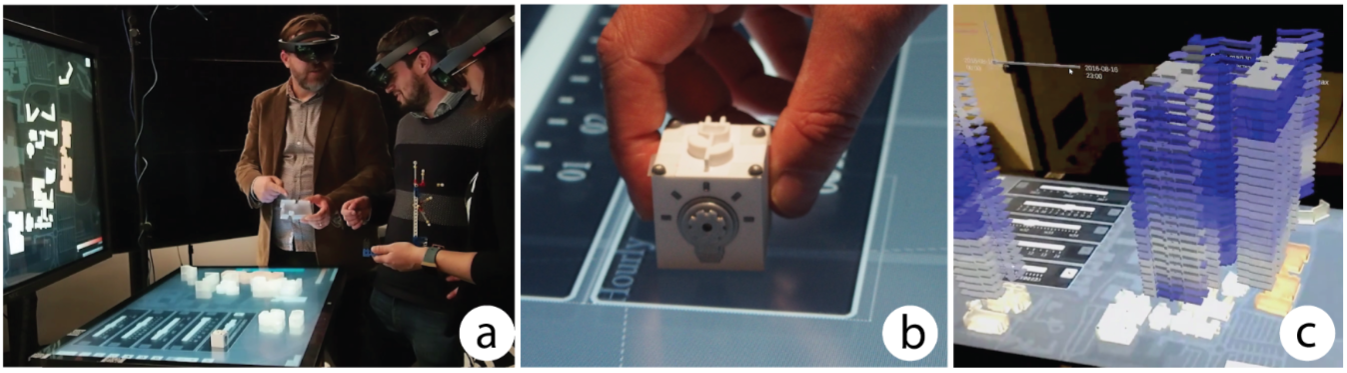
UpLift: A Tangible and Immersive Tabletop System for Casual Collaborative Visual Analytics
Barrett Ens, Sarah Goodwin, Arnaud Prouzeau, Fraser Anderson, Florence Y. Wang, Samuel Gratzl, Zac Lucarelli, Brendan Moyle, Jim Smiley, Professor Tim Dwyer
IEEE VAST Conference (IEEE VIS), to appear in IEEE TVCG, 2020.
pre-print
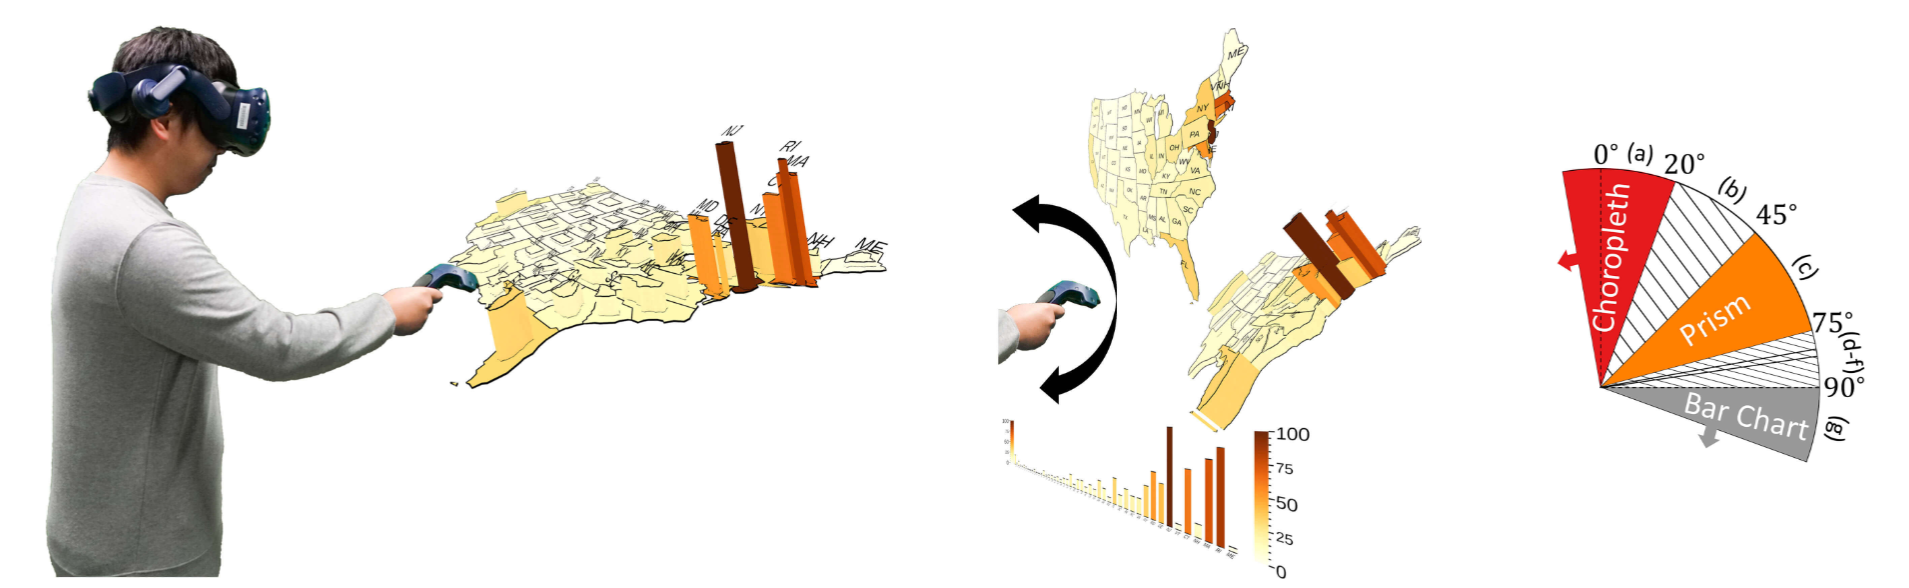
Tilt Map: Interactive Transitions Between Choropleth Map,
Prism Map and Bar Chart in Immersive Environments
Yalong Yang, Tim Dwyer, Kim Marriott, Bernhard Jenny, Sarah Goodwin
IEEE TVCG, to appear, 2020.
pre-print
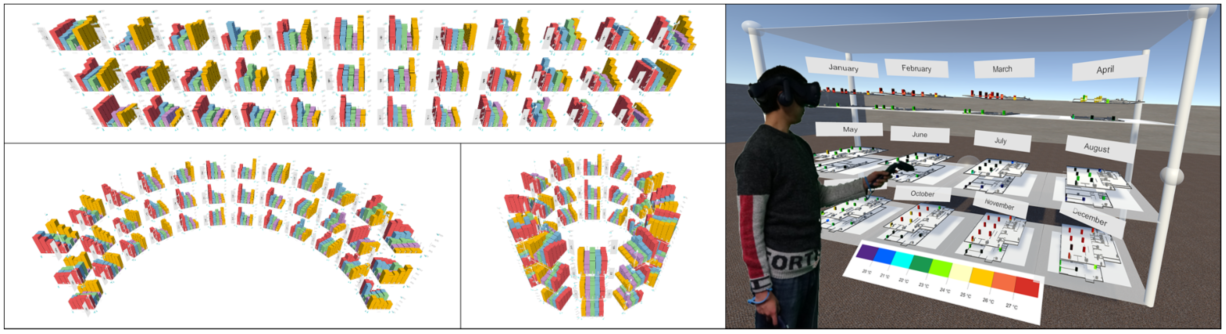
Design and Evaluation of Interactive Small Multiples Data Visualisation in Immersive Spaces
Jiazhou Liu, Arnaud Prouzeau, Barrett Ens, Tim Dwyer
IEEE VR, 2020.
pre-print

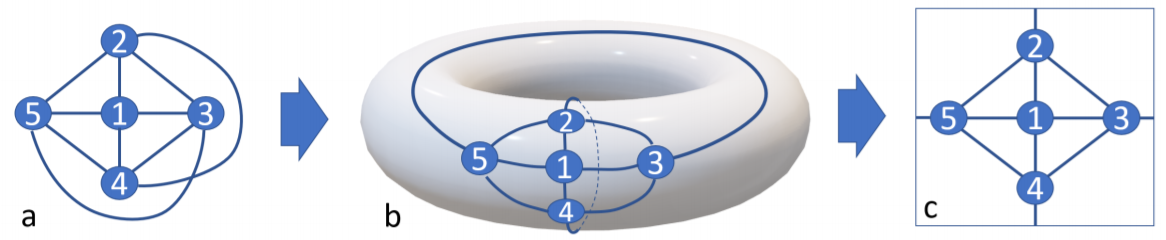
DoughNets: Visualising Networks Using Torus Wrapping
Kun-Ting Chen, Tim Dwyer, Kim Marriott, Benjamin Bach
ACM CHI, 2020.
pre-print

Embodied Axes: Tangible, Actuated Interaction for 3D Augmented Reality Data Spaces
Maxime Cordeil, Benjamin Bach, Andrew Cunningham, Bastian Montoya, Ross T. Smith, Bruce H. Thomas, Tim Dwyer
ACM CHI, 2020.
pre-print
video.

Visual Link Routing in Immersive Visualisation
Arnaud Prouzeau, Antoine Lhuillier, Barrett Ens, Daniel Weiskopf, Tim Dwyer
ACM ISS, 2019.
pre-print

There Is No Spoon: Evaluating Performance, Space Use, and Presence with Expert Domain Users in Immersive Analytics
Andrea Batch, Andrew Cunningham, Maxime Cordeil, Niklas Elmqvist, Tim Dwyer, Bruce H. Thomas
IEEE TVCG, 2019.
pre-print
An Emotional Response to the Value of Visualization
Yun Wang, Adrien Segal, Roberta Klatzky, Daniel F. Keefe, Petra Isenberg, Jörn Hurtienne, Eva Hornecker, Tim Dwyer, Stephen Barrass
IEEE CG&A, 2019.
pre-print
Immersive Analytics
K. Marriott, F. Schreiber, T. Dwyer, K. Klein, N. Henry Riche, T. Itoh, W. Stuerzlinger, B. Thomas (Eds.)
Springer, 2019.
Chapter Author Pre-prints:
Chapter 1: Immersive Analytics an Introduction
T. Dwyer, K. Marriott, T. Isenber, K. Klein, N. Henry Riche, F. Schreiber, W. Stuerzlinger, B. H. Thomas
Chapter 4: Interaction For Immersive Analytics
W. Buschel, J. Chen, R. Dachselt, S. Drucker, T. Dwyer, C. Gorg, T. Isenberg, A. Kerren, C. North, W. Stuerzlinger
Chapter 5: Immersive Human-Centred Computational Analytics
W. Stuerzlinger, T. Dwyer, S. Drucker, C. Gorg, C. North, G. Scheuermann
IATK: An Immersive Analytics Toolkit
M. Cordeil, A. Cunningham, B. Bach, C. Hurter, B.H. Thomas, K. Marriott, T. Dwyer
IEEE VR, 2019.
pre-print
video
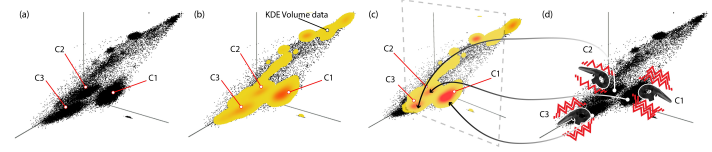
Scaptics and Highlight-Planes: Immersive Interaction Techniques for Finding Occluded Features in 3D Scatterplots
Arnaud Prouzeau, Maxime Cordeil, Clément Robin, Barrett Ens, Bruce Thomas and Tim Dwyer
ACM CHI, 2019.
pre-print
video

Origin-Destination Flow Maps in Immersive Environments
Yalong Yang, Tim Dwyer, Bernhard Jenny, Kim Marriott, Maxime Cordeil and Haohui Chen
IEEE InfoVis, 2018.
pre-print
video

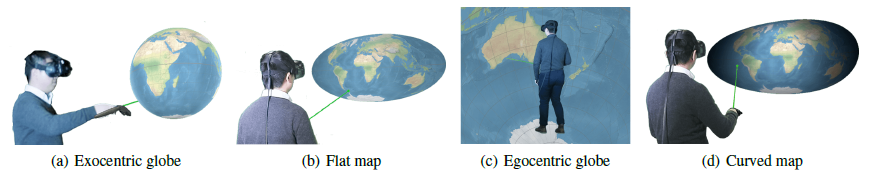
Maps and Globes in Virtual Reality
Yalong Yang, Bernhard Jenny, Haohui Chen, Maxime Cordeil, Tim Dwyer and Kim Marriott
Eurovis, 2018.
pre-print
video
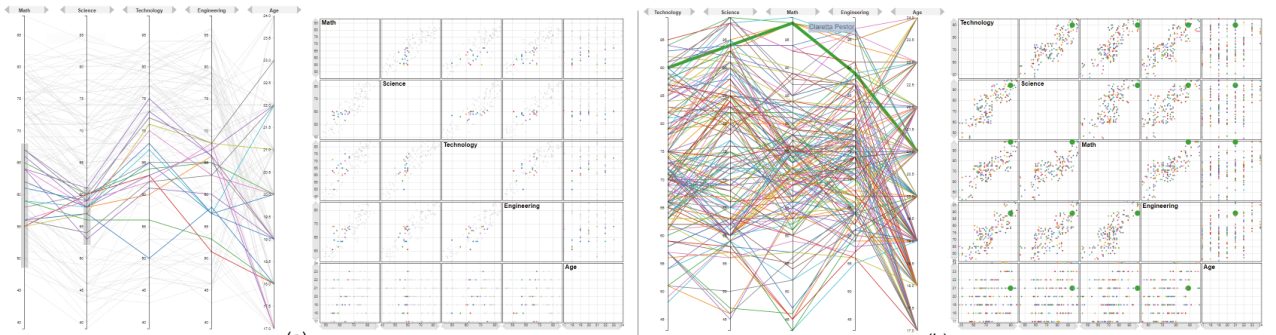
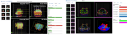
An Evaluation of Perceptually Complementary Views for Multivariate Data
Chunlei Chang, Tim Dwyer, Kim Marriott
IEEE PacificVis, 2018 (pp. 195-204).
pre-print.
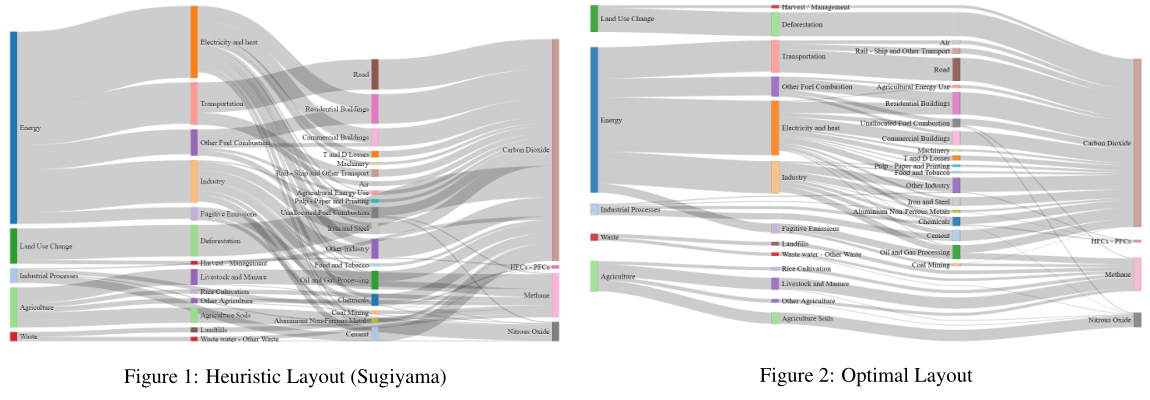
Optimal Sankey Diagrams via Integer Programming
David Cheng Zarate, Pierre Bodic, Tim Dwyer, Graeme Gange, Peter Stuckey
IEEE PacificVis, 2018, 135-139.
Best Note Award
pre-print.

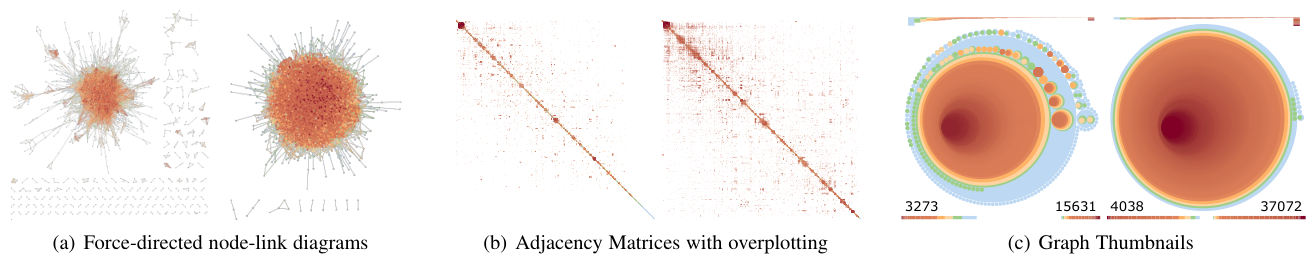
Graph Thumbnails: Identifying and Comparing Multiple Graphs at a Glance
Vahan Yoghourdjian, Tim Dwyer, Karsten Klein, Kim Marriott, and Michael Wybrow
IEEE Transactions on Visualization and Computer Graphics (TVCG), 2018.
pre-print.

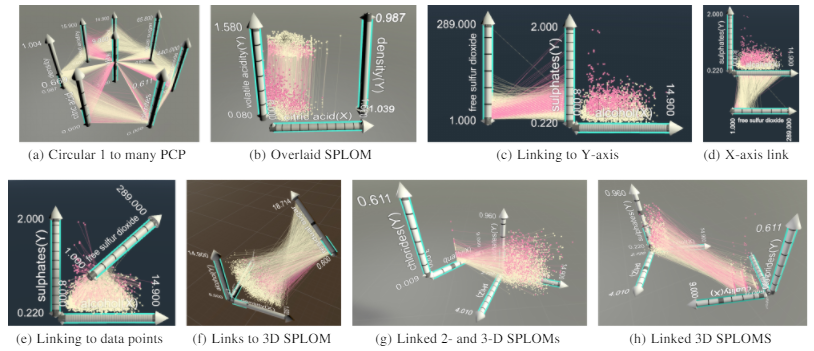
ImAxes: Immersive Axes as Embodied Affordances for Interactive Multivariate Data Visualisation
Maxime Cordeil, Andrew Cunningham, Tim Dwyer, Bruce H. Thomas and Kim Marriott
Proceedings of the 30th Annual ACM Symposium on User Interface Software and Technology (UIST), pp. 71-83, ACM 2017.
pre-print video.
Understanding the Relationship between Interactive Optimisation and Visual Analytics in the Context of Prostate Brachytherapy
Jie Liu, Tim Dwyer, Kim Marriott, Jeremy Millar and Annette Haworth
IEEE VAST 2017, IEEE transactions on visualization and computer graphics 24 (1), 319-329, 2017.
pre-print.
A Design Space for Spatio-Data Coordination:
Tangible Interaction Devices for Immersive Information Visualisation
Maxime Cordeil, Benjamin Bach, Yongchao Li, Elliott Wilson, Tim Dwyer
PacificVis 2017 Notes, Pacific Visualization Symposium (PacificVis), 2017 IEEE, 46-50.
pre-print.

Evaluating Perceptually Complementary Views for Network Exploration Tasks
Chunlei Chang, Benjamin Bach, Tim Dwyer, Kim Marriott
In Proceedings of the 2017 CHI Conference on Human Factors in Computing Systems, ACM CHI (pp. 1397-1407), 2017.
pre-print.
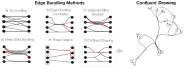
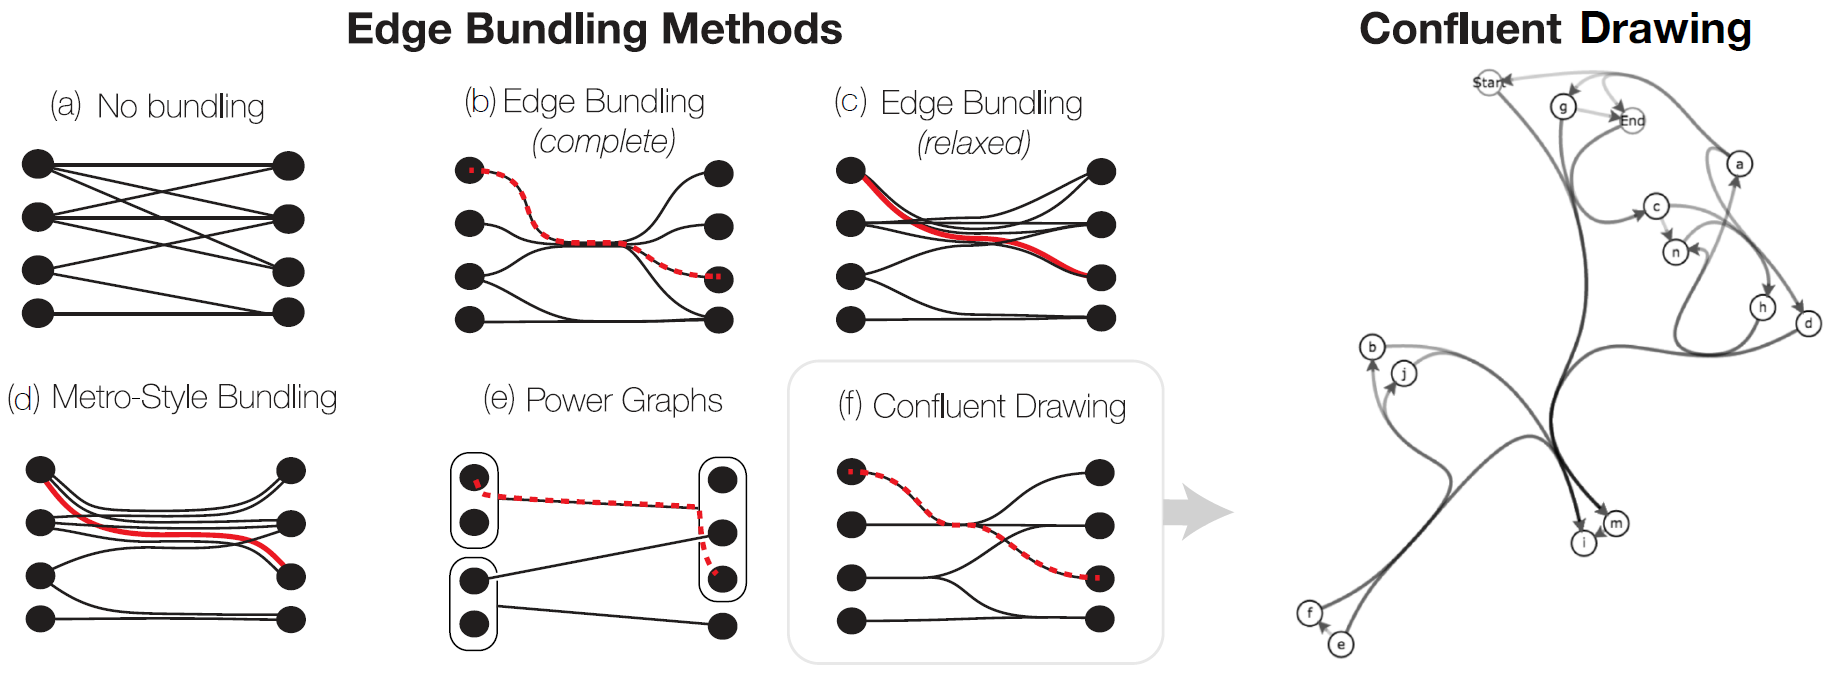
Towards Unambiguous Edge Bundling: Investigating
Confluent Drawings for Network Visualization
Benjamin Bach, Nathalie Henry Riche, Christophe Hurter, Kim Marriott, Tim Dwyer
IEEE transactions on visualization and computer graphics 23 (1), 541-550, 2016.
pre-print
demos.

Network Visualization as a Higher-Order Visual Analysis Tool
Tim Dwyer,
IEEE computer graphics and applications 36(6), pp. 78-85, 2016.
pre-print

What do Constraint Programming Users Want to See?
Exploring the role of Visualisation in Profiling of Models and Search
Sarah Goodwin, Christopher Mears, Tim Dwyer, Maria Garcia de la Banda, Guido Tack and Mark Wallace
IEEE transactions on visualization and computer graphics 23 (1), 281-290, 2016.
pre-print
video.

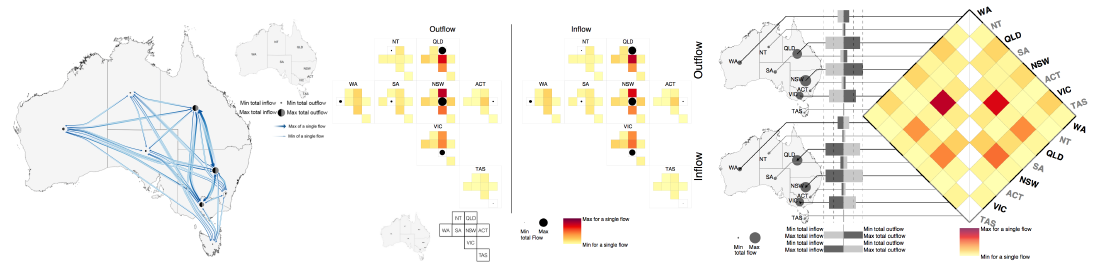
Many-to-Many Geographically-Embedded
Flow Visualisation: An Evaluation
Yalong Yang, Tim Dwyer, Sarah Goodwin and Kim Marriott
IEEE transactions on visualization and computer graphics 23 (1), 411-420, 2016.
Infovis 2016 Honorable Mention for Best Paper Award
pre-print
video.

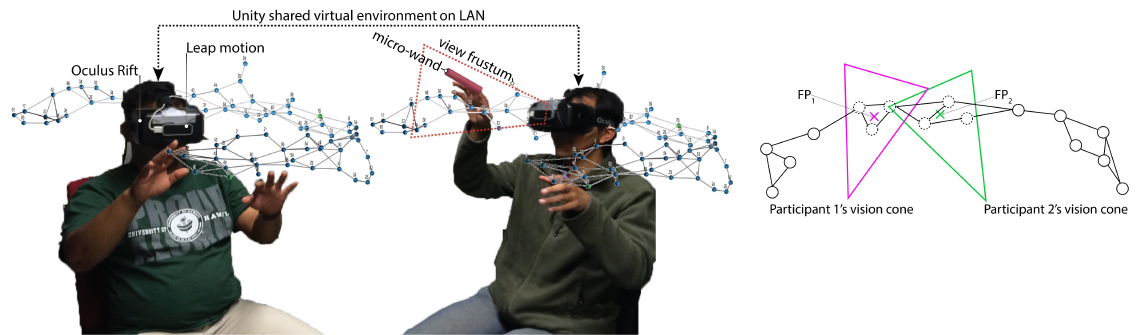
Immersive Collaborative Analysis of Network Connectivity:
CAVE-style or Head-Mounted Display?
Maxime Cordeil, Tim Dwyer, Karsten Klein, Bireswar Laha, Kim Marriott, Bruce H. Thomas
IEEE Transactions on Visualization and Computer Graphics 23 (1), 441-450, 2016.
pre-print.

Visual Encoding of Dissimilarity Data via Topology-Preserving Map
Deformation
Collaboration with TU Eindhoven, City University
London and Microsoft Research USA.
Transactions on Visualization and Computer Graphics 22 (9), 2200 - 2213, 2016.
pre-print.
High-Quality Ultra-Compact Grid Layout of Grouped Networks
Vahan Yoghourdjian, Tim Dwyer, Graeme Gange, Steve Kieffer, Karsten Klein, and Kim Marriott.
Presented at Infovis 2015.
pre-print.

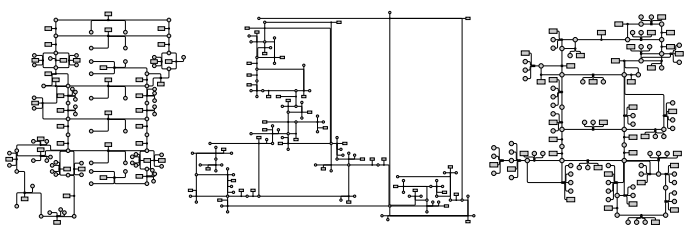
HOLA: Human-like Orthogonal Network Layout
Steve Kieffer, Tim Dwyer, Kim Marriott and Michael Wybrow.
Infovis 2015 Best Paper Award
pre-print.
Stress-Minimizing Orthogonal Layout of Data Flow Diagrams with Ports
U Rüegg, S Kieffer, T Dwyer, K Marriott, M Wybrow
Proc. of Graph Drawing 2014, 319-330
pdf
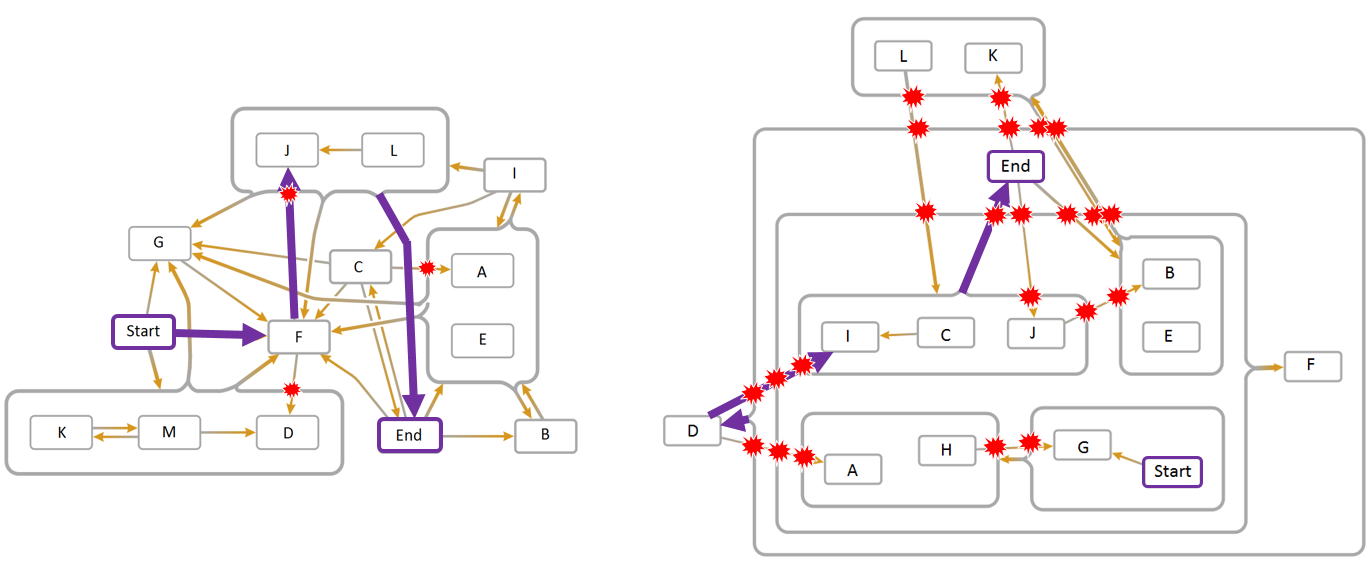
Improved Optimal and Approximate Power Graph Compression
for Clearer Visualisation of Dense Graphs
T Dwyer, C Mears, K Morgan, T Niven, K Marriott, M Wallace
Pacific Visualization Symposium (PacificVis), 2014 IEEE, 105-112
pdf

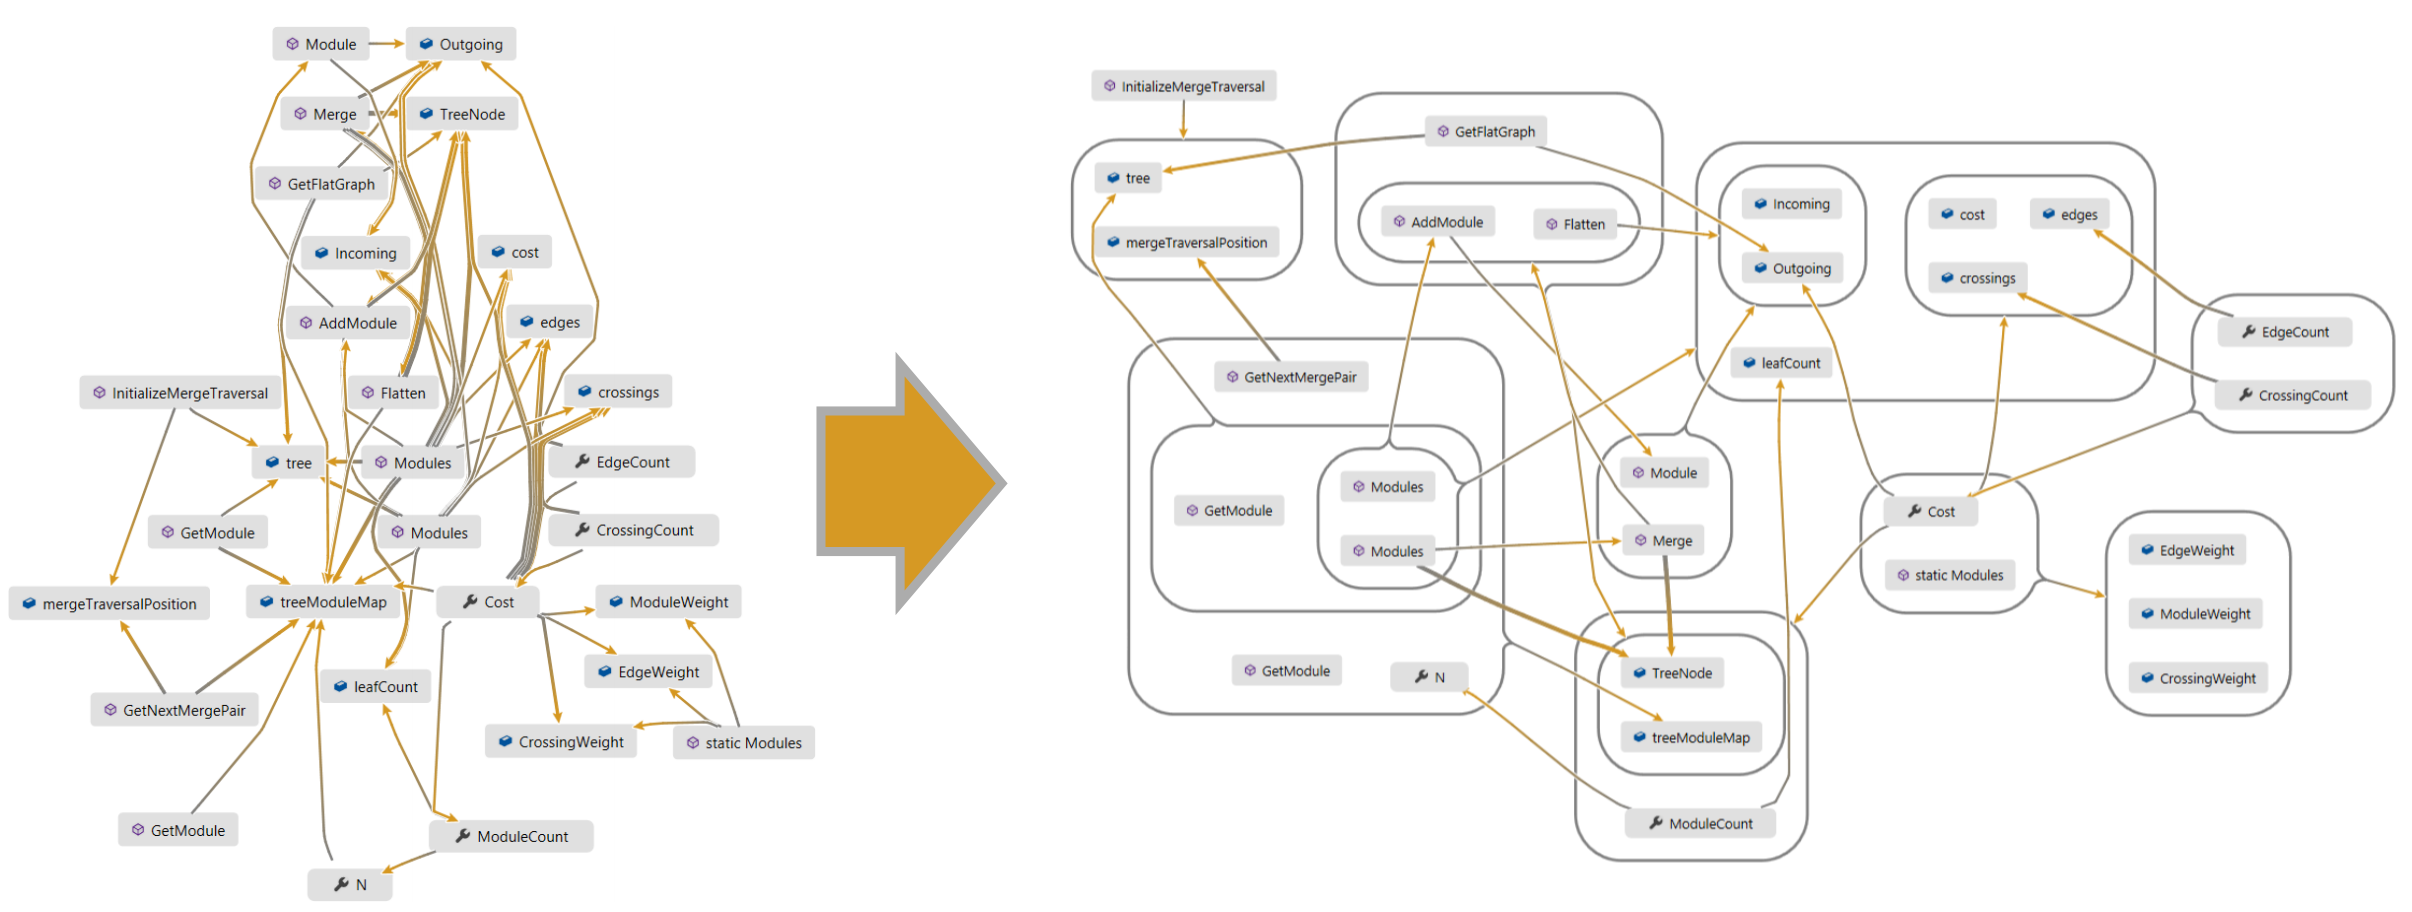
Edge compression techniques for visualization of dense directed graphs
T Dwyer, NH Riche, K Marriott, C Mears
Presented at InfoVis 2013
Visualization and Computer Graphics, IEEE Transactions on 19 (12), 2596-2605
pdf